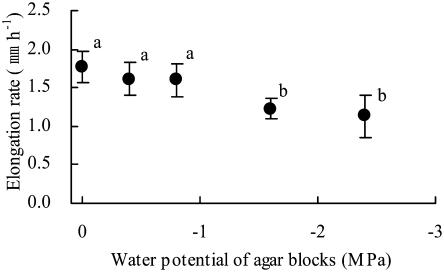
Figure 1.
Growth responses of primary roots to the water potential of pairs of agar blocks applied to the root tip. The graph shows the average elongation rate for 5 h after agar blocks had been applied to the root tip. Bars represent sds (n = 6–7). Letters (a and b) indicate statistically significant differences between treatments (Tukey-Kramer test; P = 0.05).

