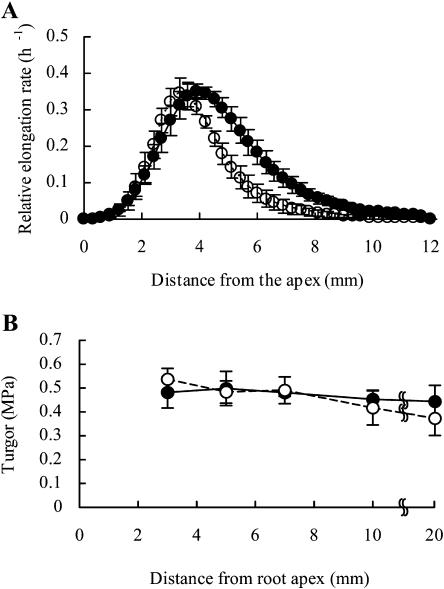
Figure 3.
Spatial distribution of elongation rates (A) and cell turgor pressures (B) in primary roots. Each root was marked with black ink at 1-mm intervals from the root apex to a distance of 15 to 20 mm from the apex. The elongation rate was derived from the measurements of the displacement of each mark from the apex from 2 to 4 h after the agar blocks had been applied to root tips. Cell turgor pressure was measured at the exodermis or most-external cortex 2 h after the application of agar blocks. Closed and open circles represent water potentials of the agar blocks applied to roots of −0.03 and −1.6 MPa, respectively. Bars represent the sds (n = 3 in A and n = 7–8 in B).

