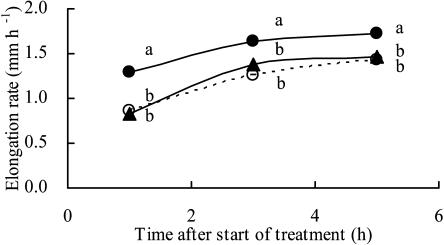
Figure 4.
Effects of the water potential of agar blocks applied to root tips on the elongation rate of the primary root. Closed and open circles represent root elongation rates for roots with agar blocks with water potentials of −0.03 and −1.60 MPa, respectively. Closed triangles represent the elongation rate of roots to which agar blocks with a water potential of −1.60 MPa were applied for the first 2 h of the experiment. Thereafter, these agar blocks were replaced by blocks with a water potential of −0.03 MPa. Letters (a and b) indicate significant differences between treatments at each time point according to lsd at P = 0.05 (n = 12–22).

