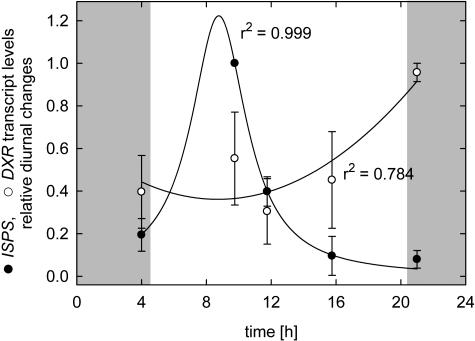
Figure 5.
Relative diurnal changes in transcript levels of PcDXR and PcISPS obtained from four diurnal curves. Minimum and maximum values of each individual day were set to 0 and 1 for normalization, respectively (n = 4 d ± se). Regression analysis was performed with Sigmaplot 2000 for Windows (Version 6.10; SPSS). Shaded regions symbolize dark periods.

