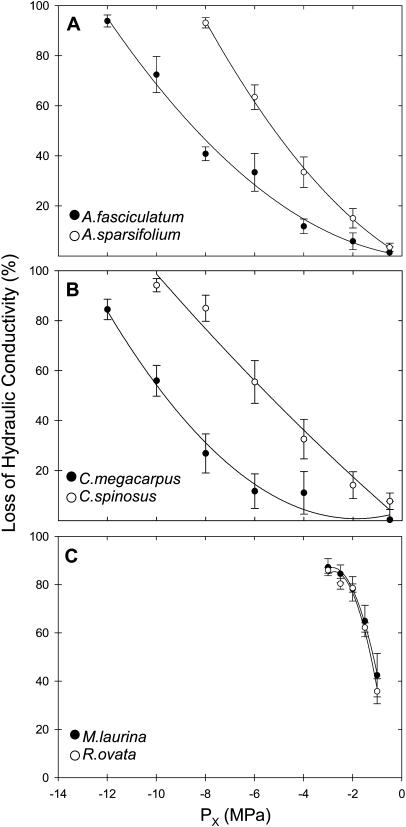
Figure 3.
Percentage of loss of hydraulic conductivity of stems as a function of xylem pressure potential (Px). Curves were fit with a second order polynomial (r2 ≥ 0.99 and P ≤ 0.01, for all curves). Means ± 1 se are shown with n = 6 plants per species. The graphs were used to calculate for each species the xylem pressure at which there was 50% loss of conductivity (P50 in Figs. 4 and 5).

