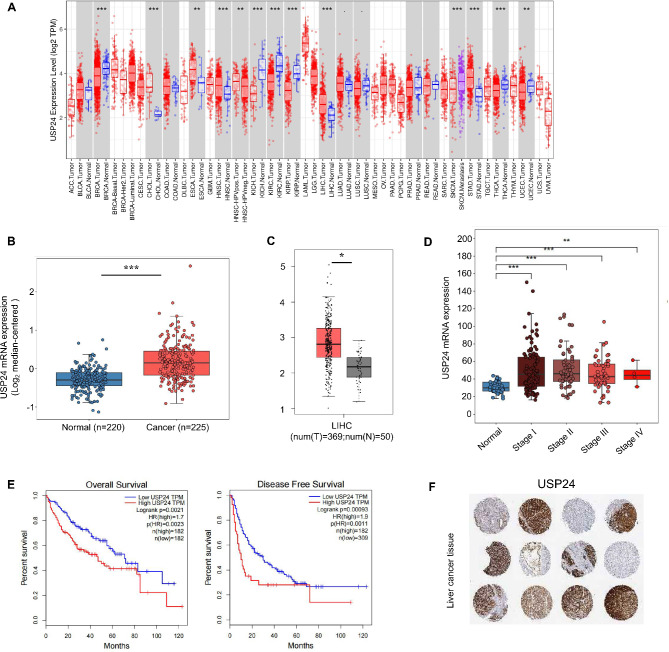
Fig. 4.
USP24 is upregulated and associated with a poor prognosis in HCC. A USP24 mRNA expression level in different tumor tissues and non-tumor tissues from TCGA database was detected by TIMER 2.0 (http://timer.cistrome.org/). The red dots represent tumor tissues, while the blue dots represent normal tissues. B Analysis of TCGA liver cancer (Roessler Liver 2) from Oncomine database concerning the expression of USP24 in normal liver tissues and HCC tumor tissues. Data are presented by box plots. Fold change, P values (determined by Student’s t-test), and sample size are shown. C Comparison of the USP24 mRNA expression level in the TCGA-LIHC database on the GEPIA platform. D Analysis of the USP24 mRNA expression level based on the tumor stages in HCC tissues according the TCGA-LIHC database. E Prognostic survival analysis of the overall survival (OS) or disease-free survival (DFS) for USP24 gene from TCGA in HCC patients, using the GEPIA platform. The log-rank P < 0.05 is considered as a statistically significant value. The red and blue lines represent high and low expressions of USP24 gene. F Expression of USP24 in patients with HCC patients was generally high. The representative IHC images were from the Human Protein Atlas database (n = 12).*P < 0.05, **P < 0.01, and ***P < 0.001

