
Fig. 3. Effects of outcome revaluation training on fixed-interval responding.
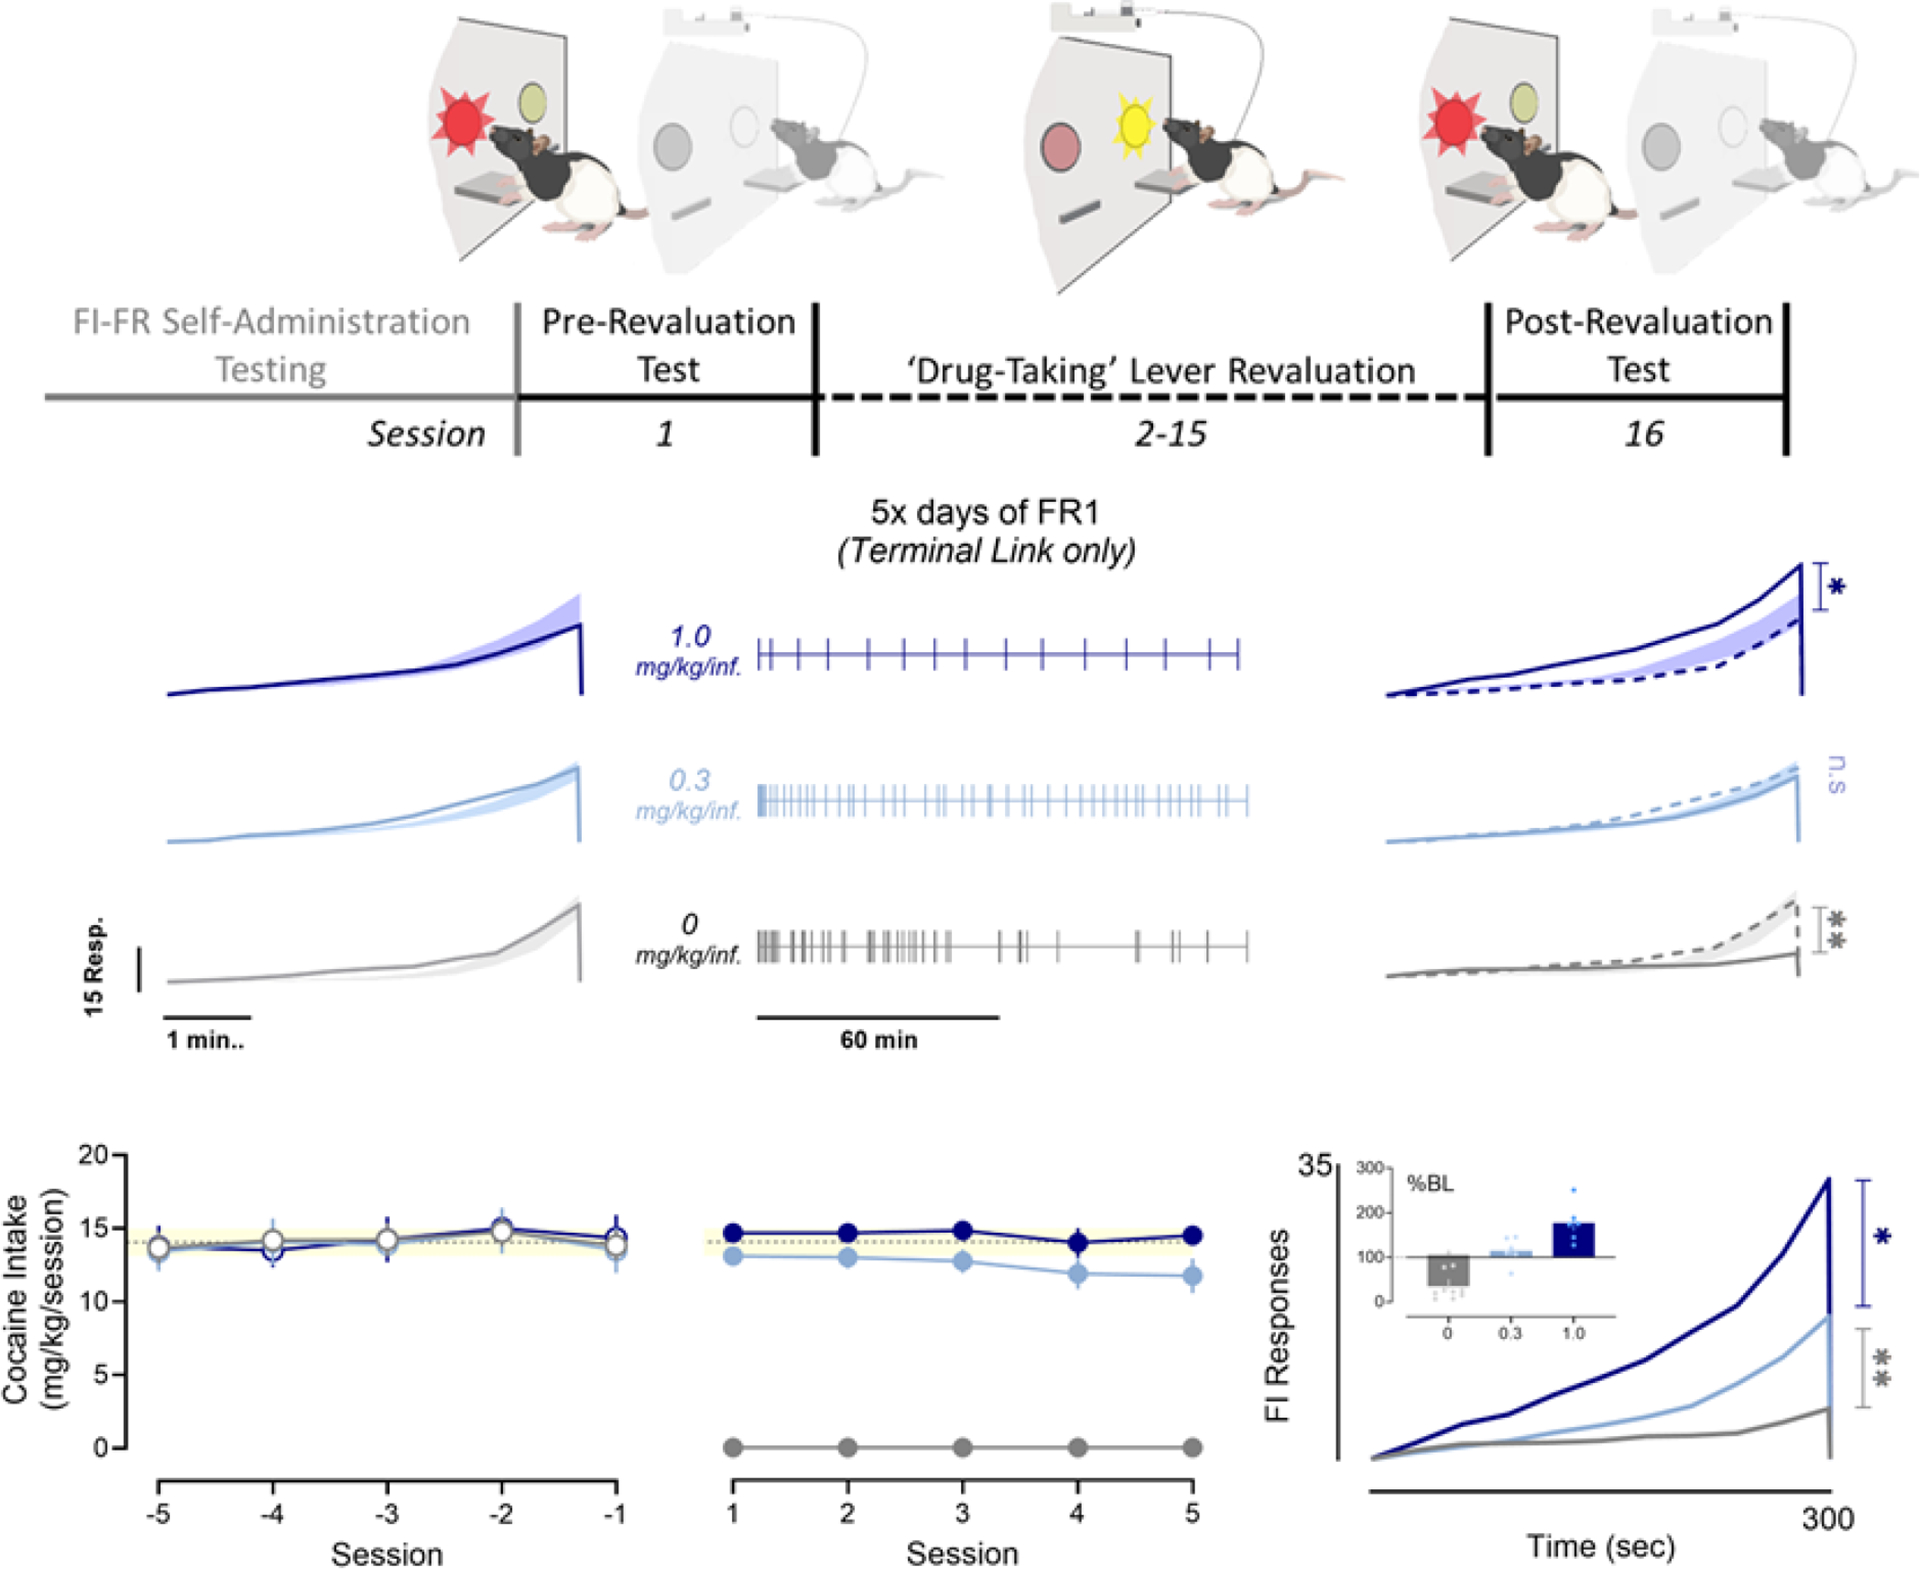
The event record depicts a representative 5-day period of self-administration on various doses of cocaine, when only the drug-taking lever was available. Tick marks indicate infusions, session means (± SEM) shown below. Mean fixed-interval response records for trials immediately before (Left) or after training (Right) for each group are shown as a solid trace, along with pre-revaluation test values (dotted trace). The shaded region that joins accompanies each FI trace represents the ± SEM of each group’s pre-testing baseline. Post-training response records are overlaid for between-group comparison (Bottom Right). Inset figure depicts total FI response during the post-test as percent pre-test.