
Fig. 6. Unconditioned manipulation of outcome value alters performance for saccharin reward under FI-FR response chain.
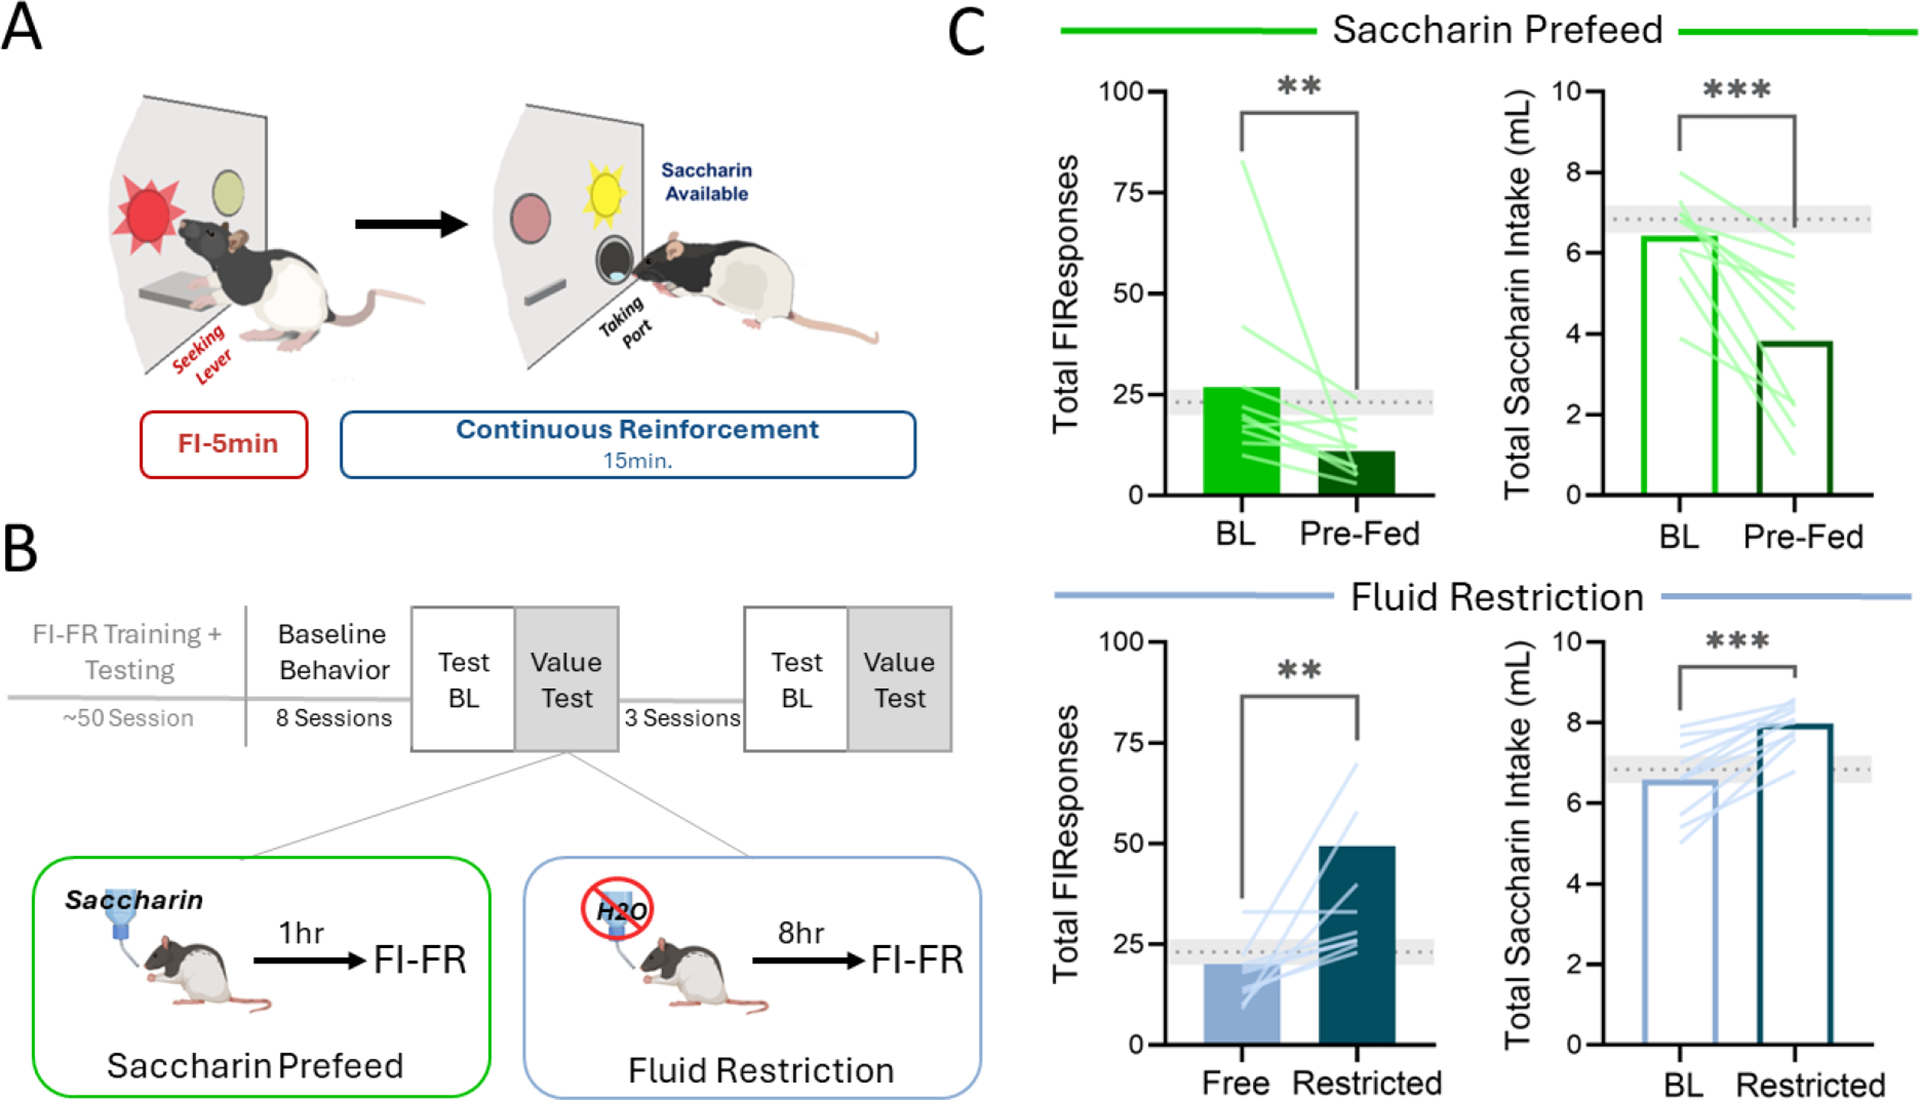
A) Cartoon diagram of FI-FR procedure with 0.1% saccharin solution as the primary reinforcer and B) schematic for outcome value testing. C) Pre-session access to saccharin resulted in both reduced FI responding and saccharin intake (top). Fluid restriction prior to testing enhanced both responding for saccharin access and subsequent saccharin intake (bottom). Grey dotted lines indicate mean (± SEM; shaded) FI responses and saccharin intake, respectively, from the 8 FI-FR sessions immediately prior to testing. *p<.05, ,**p < .01,***p < 0.001