. 2025 Apr 24;16(21):9413–9423. doi: 10.1039/d5sc01488c

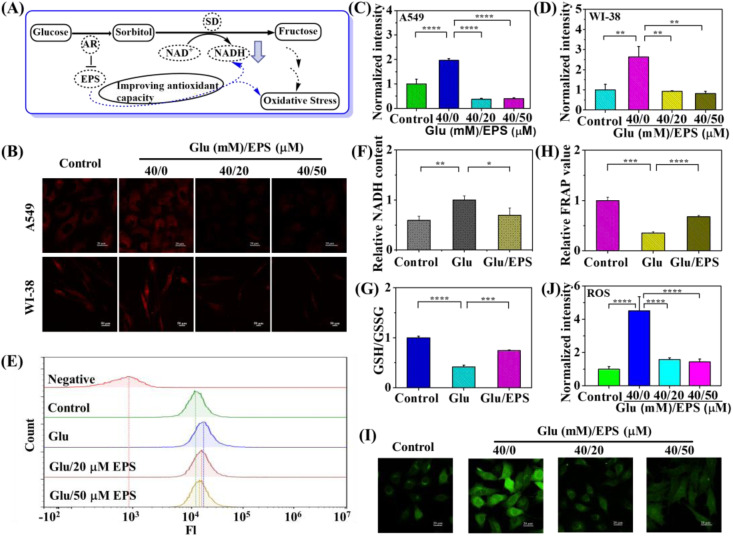
Fig. 4. (A) The proposed mechanistic pathway of EPS for relieving diabetic lung diseases. (B) Fluorescence images of NADH in A549 and WI-38 cells treated with only NBON (15 μM) or incubated with EPS (0, 20 and 50 μM) for 24 h before glucose stimulation (40 mM) for 12 h. Scale bar: 20 μm for A549 cells and 50 μm for WI-38 cells. (C and D) Relative fluorescence intensity in B for A549 and WI-38 cells. (E) Flow cytometric analysis of intact cells-loaded NBON incubated with glucose/epalrestat (40 mM/0 μM, 40 mM/20 μM and 40 mM/50 μM). (F) Measurement of NADH from cells incubated with glucose/epalrestat (40 mM/0 μM and 40 mM/50 μM). (G) Measurement of GSH/GSSG from cells incubated with glucose/epalrestat (40 mM/0 μM and 40 mM/50 μM). (H) Measurement of FRAP value from cells incubated with glucose/epalrestat (40 mM/0 μM and 40 mM/50 μM). (I) Fluorescence images of ROS in A549 treated with only commercial probe DCFH-DA (20 μM) or incubated with EPS (0, 20 and 50 μM) for 24 h before glucose stimulation (40 mM) for 12 h. Scale bar = 20 μm. (J) Relative fluorescence intensity in I. (n ≥ 3, data expressed as mean ± SD, *P < 0.05, **P < 0.01, ***P < 0.001, and ****P < 0.0001, Student's t-test).

Fig. 4