

Abstract

Interaction between small molecules (ligands) and a protein is the basis of protein function and drug action. Therefore, it is essential to know the number and binding constants of specific binding sites that are most relevant to protein functions. These binding parameters can be estimated by the analysis of the average number of bound ligands per protein (r) as a function of free ligand concentration ([L]f). Frontal gel filtration chromatography (FGC) is a well-established method to obtain a fraction of free ligand from a protein–ligand mixture without any disturbance of the original binding equilibrium of the mixture. The ligand concentration of this fraction gives [L]f, and r is obtained as the ratio of the difference between the total ligand concentration and [L]f to the total protein concentration. The serious drawback of conventional FGC is large sample consumption to perform a single experiment. Here, we improved FGC using microbore columns packed with gel matrix (particle size 4 μm, pore size 12.5 nm) and an automated injection system to reduce sample consumption to 100 μL levels. Its performance was tested on the interaction of 5 vertebrate serum albumins with aromatic compounds of methyl orange, dabsyl amino acids, and S- and R-warfarin. A subtle chiral difference in the warfarin binding was clearly detected for human serum albumin. A large species difference in S-warfarin binding to albumin was also found. Further scale-down of FGC with a capillary column is suggested to be possible by simulation using the program developed in the present study, promising broader application of FGC to various binding systems.
Introduction
Serum albumin is the most abundant protein in vertebrate plasma (about 0.6 mmol/L) and transports various small molecules (hereafter called ligands) such as fatty acids, bilirubin, and thyroid hormones to the whole body. Serum albumin also binds numerous exogenous ligands including drugs, food-derived phytochemicals, and pollutants.1−3 The interaction of these ligands with serum albumin affects profoundly the tissue distribution kinetics of each ligand, which is one of the essential factors to determine its beneficial or detrimental effects on the animal health. Using nearly all available methods, the interaction of human serum albumin (HSA) and bovine serum albumin (BSA) with various kinds of ligands has been investigated. However, the accumulated binding data is obtained under various experimental conditions such as pH, temperature, and buffer systems, making it difficult to compare the relevant data. In addition, the binding data for serum albumins from animals used as disease and toxicological models (mouse, rat, rabbit, chicken, pig, etc.) is very scarce. On the other hand, X-ray crystallographic studies and theoretical studies on the binding properties of serum albumins besides HSA have greatly advanced recently.4−10 Therefore, a systematic collection of binding data of serum albumins is essential to further advance these research fields. In the present study, we have improved frontal gel filtration chromatography (FGC) to be applicable to the collection of albumin binding data.
Most ligands bind to two or more specific sites on serum albumin.
This kind of multiple binding is generally represented by the following
scheme involving the successive binding of the ligand.11−13 where P is the free protein, L is the free ligand, PLi is
the protein complexed with i ligand molecules, and n is the total
number of binding sites. It should be noted that PLi consists of n!/((n – i)!i!) distinct complexes, where x! is factorial of x (x = n, n – i, and i). For example, in the case of n = 4, PL, PL2, and PL3 consist of 4, 6, and
4 distinct complexes, respectively, and 15 kinds of complexes exist
in total. It is still challenging to directly determine the concentration
of each protein–ligand complex, although recent native mass
spectrometry opens the way to determine the relative amount of PLi.14,15 Therefore, in the present study, we decided to measure directly
the free ligand concentration ([L]f) of a protein–ligand
mixture. If we know [L]f, the concentration of the bound
ligand ([L]b) is obtained as
where P is the free protein, L is the free ligand, PLi is
the protein complexed with i ligand molecules, and n is the total
number of binding sites. It should be noted that PLi consists of n!/((n – i)!i!) distinct complexes, where x! is factorial of x (x = n, n – i, and i). For example, in the case of n = 4, PL, PL2, and PL3 consist of 4, 6, and
4 distinct complexes, respectively, and 15 kinds of complexes exist
in total. It is still challenging to directly determine the concentration
of each protein–ligand complex, although recent native mass
spectrometry opens the way to determine the relative amount of PLi.14,15 Therefore, in the present study, we decided to measure directly
the free ligand concentration ([L]f) of a protein–ligand
mixture. If we know [L]f, the concentration of the bound
ligand ([L]b) is obtained as
| 1 |
where [L]t is the total ligand concentration of the mixture. The average number of the bound ligand per protein molecule (r) is calculated as
| 2 |
where [P]t is the total protein concentration of the mixture. Changing the ratio of [P]t/[L]t of protein–ligand mixtures appropriately, the dependence of r on [L]f (binding curve) is obtained. Compared to various methods measuring [L]b-related signals using a small amount of protein, direct determination of [L]f requires higher concentration of the protein as [L]t increases because it is necessary that at least 10% of the ligand molecules are in the bound form to obtain [L]b with 2 significant figures (eq 1). Therefore, to perform experiments using practical amounts of protein, it is essential that direct measurement of [L]f can be achieved using as small sample volumes as possible.
Frontal analysis is a method to separate a fraction containing only free ligand from a protein–ligand mixture by forcing a substantial volume of the mixture to migrate through a tube.16 When this migration process satisfies the following three conditions, the ligand concentration of the free ligand fraction is identical to [L]f in the original mixture. (1) Free protein and all the complexes migrate along the tube at the same speed. (2) Second, free ligands move down the tube at a sufficiently different speed compared to protein. (3) Third, protein–ligand interaction is at equilibrium everywhere in the tube. Gel filtration chromatography can attain the conditions (1) and (2) by selecting the pore size of a porous matrix.
For instance, the pore of Sephadex G-25 (Sigma-Aldrich) excludes globular proteins with molecular mass larger than 5 kDa, and thus the gel is conveniently used to remove salts and small molecular contaminants from protein samples. If we use a Sephadex G-25 column to examine the interaction of serum albumin (about 66 kDa) and small molecules, then these two conditions are expected to be attained. The third condition is satisfied for relatively weak binding systems with the dissociation constant (Kd) of 1–1000 μM because both on- and off-processes of the ligand binding are rapid compared to the chromatographic time scale. Nichol and Winzor investigated the elution profiles of ovalbumin–lysozyme mixtures using a Sephadex G-100 column (1.25 cm × 32 cm, bed volume 39 mL) and a sample injection volume of 20 mL.17 Sephadex G-100 is formed from agarose and has the pores excluding globular proteins with a molecular mass larger than 150 kDa. The elution of lysozyme showed two plateau regions, and the lysozyme concentration of the later plateau region was verified to give the free lysozyme concentration of the mixture on the basis of the theory proposed by Gilbert and Jenkins.16 Cooper and Wood applied a Sephadex G-25 column (0.5 cm × 15 cm, bed volume 2.9 mL) to perform frontal analysis of the interaction of BSA with sulfonamides using a 12 mL sample, and they compared the method (FGC) with equilibrium dialysis.18
FGC is experimentally simple, but large sample consumption has hindered its widespread application. In soft gel years, a sample volume of 10–60 mL was required for a single experiment.18−21 The use of porous gel beads developed for HPLC has reduced the sample volumes to 1–2.5 mL but still too large.22,23 In the present study, we used a TSKgel SuperSW2000 (Tosoh, Tokyo, Japan) and a Superdex peptide (Sigma-Aldrich). TSKgel SuperSW2000 consists of 4 μm silica particles with 12.5 nm size pores, which exclude globular proteins with a molecular mass larger than 150 kDa. Superdex peptide consists of 13 μm dextran composite particles with pores that exclude globular proteins with a molecular mass larger than 7 kDa. To estimate the performance of a microbore column packed with these porous gel particles, we developed a program to simulate elution profiles of a protein–ligand mixture in the case of 1:1 binding (Supporting Information). This program requires the following parameters: column size, gel particle size, the volume of the buffer outside the particles (void volume, V0), the volume of the buffer inside the pores (internal volume, Vi), [P]t, [L]t, sample injection volume (Vs), and Kd. Figure 1a shows typical theoretical FGC chromatograms. In this simulation, the column (1.0 mm × 70 mm) is packed with a porous gel matrix, whose gel filtration properties are taken from the data of commercial TSKgel SuperSW2000 columns. When a solution only containing the ligand is applied to the column, the elution of ligand starts at V0 + Vi (40.5 μL) and ends at V0 + Vi + Vs (92.4 μL, thin line in Figure 1a). In the case of a mixture, the ligand chromatogram exhibits two plateau regions, p1 and p2 (thick line in Figure 1a). In the presence of the protein, ligand molecules migrate along the column faster because the bound ligand molecules move down the column at the same speed as the protein migration, resulting in the start of the elution at V0 + Vi[L]f/[L]t (33.9 μL). After the elution of the protein is finished (trailing boundary of the dotted line in Figure 1a), the ligand molecules remaining in the column move down at the speed of free ligands, and the elution ends at V0 + Vi + Vs (92.4 μL). Figure 1b summarizes the relationship between the column parameters (V0, Vi) and each elution boundary, which is changed to a straight line at the respective centroid. The areas of the two shaded square regions in Figure 1b should be identical, and it is so only when [L]p2 = [L]f, as verified under more general conditions in Supporting Information. This simulation suggests that microbore FGC is feasible. Recently, we packed TSKgel SuperSW2000 into a microbore column and tried to perform FGC with the injection of about 100 μL of sample solution.24 Here, we verified both theoretically and experimentally the applicability of this microbore FGC method to multiple binding systems by examining the interaction of BSA with methyl orange (MO) and 3 dabsyl amino acids (Figure 2). Amino acids, amines, and phenols are not only abundant in nature but also important building blocks of drugs. Dabsyl group (Figure 2) can be easily attached to these substances covalently using dabsyl chloride. Therefore, systematic examination of the interaction of dabsyl derivatives and serum albumins from various vertebrates using microbore FGC is expected to contribute to understanding in depth the mechanistic basis of binding function of serum albumins. There is a wide knowledge gap between X-ray crystallographic findings and biding data in solutions. To demonstrate that microbore FGC is helpful to fill the knowledge gap, we also examined the interaction of warfarin and serum albumins in detail.
Figure 1.

Theoretical FGC chromatogram of a protein–ligand mixture. (a) Ligand elution profile (thick line) of a mixture (51.9 μL) containing 30 μM protein and 60 μM ligand. Simulation was performed for a hypothetical gel filtration column (1.0 × 70 mm, bed volume 55 μL, 12.5 nm pore size, void volume 20.8 μL, internal volume 19.7 μL) under the following conditions: the protein size is larger than the pore size; the ligand binds to a single site on the protein (Kd = 20 μM). The elution of the original mixture makes the first plateau (p1). Just after the finish of the protein elution (broken line), the second plateau (p2) appears. Thin line shows the chromatogram of a solution (51.9 μL) containing only the ligand (60 μM). The ligand concentration of p2 ([L]p2) is identical to the free ligand concentration of the mixture [L]f, and the difference in the concentration between p1 and p2 is the bound ligand concentration ([L]b). [L]t is the total ligand concentration of the mixture. (b) Elution boundaries of FGC chromatograms. For simplicity, the centroid of each boundary is shown as a thick line. Blue line, ligand elution in the presence of protein; red line, ligand elution in the absence of the protein; and black line, protein elution. The two shaded rectangles have the same area. The equation [L]p2 = [L]f is verified in Supporting Information under more general conditions. V0, void volume; Vi, internal volume; and Vs, sample volume injected into the column.
Figure 2.

Chemical structures of ligands used for binding experiments. MO, methyl orange; Wrf, warfarin; Dabs-Gly, dabsyl glycine; Dabs-l-Ala, dabsyl-l-alanine; and Dabs-d-Ala, dabsyl-d-alanine.
Experimental Section
Serum Albumins
Fraction V albumins from human, cow, pig, and rabbit were purchased from Sigma-Aldrich Japan (Tokyo). HSA and BSA were purified from the respective Fraction V albumins using a DEAE-Sepharose CL-6B column (Sigma-Aldrich) as described previously.22 The fatty acid contents in the purified HSA and BSA are less than 0.2 mol per mol of albumin. Pig albumin and rabbit albumin (Fraction V) were first dialyzed against a large amount of Milli-Q water overnight at 4 °C, and then the dialyzed albumin was subjected to gel filtration on a TSKgel G3000SWXL column (7.8 mm × 300 mm, Tosoh, Tokyo, Japan). The monomer fraction was collected. To remove the albumin dimer completely, the fraction was resubjected to the gel filtration to obtain monomeric albumin. Rat serums from ZDF/CrlCrlj(Leprfa/+) rat (male, 11 weeks old) were purchased from OrientalBioService (Kyoto, Japan), and albumin was purified from the serum samples using affinity purification with Toyopearl AF-Blue (Tosoh) and following gel filtration on a TSKgel G3000SWXL column. All purified albumins were monomeric as judged by gel filtration, and they showed a single band in SDS-PAGE under reducing conditions. Purified albumins were stored at 4 °C until use. The albumin concentrations were determined spectrophotometrically using the following molar absorption coefficients at 280 nm (M–1cm–1): HSA, 35,200; BSA, 44,300; rat, 44,415; pig, 52,900; rabbit, 50,400. The coefficients for rat, pig, and rabbit albumin were calculated using the equation proposed by Pace et al.25
Reagents
Chemical structures of ligands used in the present study are shown in Figure 2. Racemic warfarin and R-warfarin (R-Wrf) were purchased from Sigma-Aldrich. S-warfarin (S-Wrf) was prepared from racemic warfarin according to the method developed by West et al.26 MO, glycine, l-alanine, and d-alanine were purchased from FUJIFILM Wako Chemicals (Tokyo, Japan). Dabsyl chloride was purchased from Tokyo Chemical Industry (Tokyo, Japan). Dabsyl amino acids were prepared according to the method described by Lin and Chang.27 Briefly, amino acid (0.20 mmol) was dissolved in 5 mL of 0.1 M NaHCO3 (pH 8.9). Dabsyl chloride (10 mg) was dissolved in 5 mL acetone just before use. The amino acid solution was mixed with the dabsyl chloride solution, and the mixture was incubated at 70 °C for 10 min under intermittent vortexing. After the incubation, the mixture was cooled down to room temperature, and then it was applied to a Cosmosil 75C18 column (Nacalai Tesque, Kyoto, Japan) preequilibrated with 0.1% aqueous formic acid (solvent A). The column was washed with solvent A to remove the salts and unreacted amino acid molecules, and then it was washed with 25% methanol: 75% Milli-Q water (v/v) containing 0.1% formic acid to remove MO. The dabsyl amino acid was eluted with 90% methanol: 10% Milli-Q water (v/v) containing 0.1% formic acid. The eluate was evaporated to dryness using a centrifugal evaporator under reduced pressure. The residue was dissolved in a minimum amount of methanol. The resultant solution was kept at −20 °C to crystallize the dabsyl amino acid. All ligands used in the binding experiments showed a single main peak on HPLC analysis using C18 columns. Absorption spectrum and mass spectrum of each ligand were identical to those expected.
Microbore Gel Filtration Columns
Empty stainless steel microbore columns (1/8-in. outer diameter, inner diameter 0.7, 1.0, or 1.5 mm, and 250 mm length) were obtained from GL Sciences (Tokyo, Japan). Columns of required length (50–75 mm) were made by cutting the long column with a diamond-coated file, and the new edges were polished with sandpaper. To remove shavings, the resultant columns were washed with an ultrasonic cleaning machine for 20 min in Milli-Q water, and the one end was sealed with an end fitting with frit (CRF-10 or CRF-11, GL Science). TSKgel SuperSW2000 was obtained from Tosoh and Superdex Peptide from Sigma-Aldrich. The gel (amounts in slightly excess of the column bed volume) was dispersed in 25 mL Milli-Q water by gentle shaking, and the resultant slurry was packed into the microbore columns using a 25 mL reservoir (CP-25, GL Science) with an attachment (CPA-3, GL Science) under the constant pressure of 5 MPa with a LC-20AD pump (Shimadzu, Kyoto, Japan). During the packing, no leakage was detected. After the packing, the end fitting with frit was attached to the inlet of the column. To prevent the clogging of the frits, one inline filter (0.5 μm) was set between the pump and the column inlet.
Protein–Ligand Mixtures
All binding experiments were performed in 50 mM HEPES buffer (pH 7.5, I = 0.15) at 25 °C. HEPES (11.9 g) and NaCl (23.6 g) were dissolved in about 500 mL Milli-Q-water in a 1 L volumetric flask. After adding 23.6 g of 1 M NaOH to this solution, it was diluted to 1 L with Milli-Q water. The resultant solution (HEPES buffer) showed a pH of 7.5 at 22–25 °C, and then the buffer was filtered through a 0.47 μm membrane filter (HAWP04700, Millipore). A protein stock solution for binding experiments was prepared as follows: a 100 μL aliquot of the purified albumin solution stored at 4 °C was subjected to gel filtration on a TSKgel G3000SWXL column preequilibrated with HEPES buffer. The column was developed with HEPES buffer at the flow rate of 0.8 mL/min, and the monomer peak was collected. This buffer exchange process was repeated to obtain required amounts of albumin. The combined albumin fraction was concentrated to 500–900 μM using a centrifugal filter device (Ultracel-30k, Millipore). S- and R-Wrf (1.0–1.3 mg) was dissolved in 1 mL HEPES in a 1.5 mL Eppendorf tube under continuous vortexing at room temperature for about 1–2 h. The concentration of the resultant solution was confirmed spectrophotometrically using the molar absorption coefficient at 307 nm, 14,030 M–1cm–1. MO, dabsyl glycine (Dabs-Gly), dabsyl-l-alanine (Dabs-l-Ala), and dabsyl-d-alanine (Dabs-d-Ala) (1.0–1.2 mg each) were dissolved in 5.0 mL HEPES in a 15 mL polypropylene centrifuge tube. The concentration of these stock solutions was confirmed spectrophotometrically using the following molar absorption coefficients: MO, 2.08 × 10⁴ M–1cm–1 (at 465 nm); Dabs-Gly, 2.57 × 10⁴ M–1cm–1 (at 474 nm); Dabs-l-Ala, and Dabs-d-Ala, 2.44 × 10⁴ M–1cm–1 (at 474 nm). The volume of a protein–ligand mixture prepared for each FGC experiment was 300 μL. To obtain the reliable value of [L]b, it was necessary to increase the protein concentration as the total ligand concentration increased. The concentration of the protein was also increased when the protein–ligand interaction was weak. The concentrations of the protein and the ligand of the mixtures used are summarized in Table S1.
A protein–ligand mixture was prepared by the following procedure. First, the HEPES buffer (300 μL) was added to a new 1.5 mL Eppendorf tube. Then, (xp + xL) μL was removed from the tube, where xp and xL are the volume of the protein and ligand stock solution to be added, respectively. Finally, the respective stock solutions (xp and xL μL) were added to the tube. The pipets were calibrated by weight using Milli-Q water as a calibrant (Milli-Q water density was supposed to be 1.0).
Frontal Gel Chromatography
For microbore FGC, it is essential that a sample solution is continuously applied to a gel filtration column until the undisturbed sample elutes from the column. Figure 3 shows schematically the present FGC system. We used a 3 mL syringe pump (Nano8600 TR, OSTJ Co., Ltd., Osaka, Japan), an HPLC pump with a mechanism to reduce pressure fluctuation (301M, OSTJ), a 6-port valve unit (401, OSTJ) equipped with a PEEK sample loop (0.5 mm × 80 cm, 157 μL) whose volume was 2.6–8.2 times larger than the bed volume of the column (19.2–58.9 μL), a UV–vis detector equipped with 10 μL flow cell (SPD-10Avp, Shimadzu), and a column thermostat (IGLOO–CIL, OSTJ). For manual sample injection, first, the sample loop was filled with 250 μL of the sample using a gastight syringe, which was prewashed with a 50 μL aliquot of the sample. Second, the valve was switched to connect the loop to the column. After a required amount of the sample entered the column (90–120 μL), the valve position was restored to disconnect the loop and directly run buffer into the column, achieving the sharp boundary between p1 and p2 (Figure 1a). To avoid dilution of the eluate in the flow cell and to extend the dynamic range of a linear calibration curve of ligands (e.g., the inset in Figure 4a), column eluates were online diluted 10–12-fold with Milli-Q water that was delivered at the flow rate of 90 μL/min through a T union by the HPLC pump, and the third port of the T union connected to the detector inlet. The elution of MO, dabsyl amino acids, and warfarin (5–300 μM) was monitored by absorbance at 475, 475, and 308 nm, respectively. The protein elution was monitored by absorbance at 280 nm. It is recommended to use a photodiode array detector to monitor simultaneously both the elution of the ligand and that of the protein. Generally, any ligand that shows absorption in the wavelength range from 250 to 800 nm with a molar absorption coefficient of around 103 M–1cm–1 is detectable. Because only free ligand exists in p2, it is permissible to use a wavelength where absorption of ligand and protein overlaps. In fact, the interaction between HSA and 2,3,5-triiodobenzoate could be measured by detection at 250 nm (data not shown). When a ligand has no detectable levels of absorption, it is recommended to fraction p2. The start of p2 can be known by monitoring the elution of the protein by absorption at 280 nm. The concentration of the p2 fraction can be determined by some method appropriate for the ligand. For automated sample injection, an HTS-PAL autosampler equipped with an injection valve, a wash station, and a microplate stack (AMR Inc., Tokyo, Japan) was used to perform the same procedure of sample injection as described for manual injection. The control of the autosampler and the chromatographic data acquisition were carried out using chromatography software (Clarity version 2 8.01, and the latest version 8.7, DataApex, Prague, Czech Republic).
Figure 3.

Schematic diagram of the microbore FGC system. A 250 μL aliquot of a protein–ligand mixture was loaded into the sample loop. In this figure, the valve is at the load position. The HPLC pump used has a mechanism to reduce the fluctuation in pressure by adjusting the motion of the two plungers.
Figure 4.

Binding of MO by BSA. FGC was performed in 50 mM HEPES buffer (pH 7.5, I = 0.15) at 25 °C with a TSKgel SuperSW2000 column (0.7 mm × 50 mm, bed volume 19.2 μL). Flow rate, 8.0 μL/min; injection volume, 120 μL. (a) Chromatograms of MO solutions. The inset is a plot of the absorbance at 475 nm of the plateau region against the MO concentration. (b) Chromatograms of BSA-MO mixtures containing 61.9 μM BSA and varying concentrations of MO (from bottom to top, the total MO concentration as in a). The p1 and p2 plateaus are indicated on the top chromatogram by horizontal lines. The MO concentration of p2 was calculated using the calibration curve shown in the inset in a. Small levels of periodic noise are noticeable in the top two chromatograms. (c) The average number of bound MO per BSA molecule (r) was plotted against the free MO concentration. The line is the best-fit binding curve: r = 3[L]f/(447 + [L]f) + 0.000938[L]f, model (3, Kd, a).
Data Analysis
Almost all the binding curves did not level off over the [L]f ranges obtained. All the maximal r values (rmax) observed were larger than 1 except for Dabs-l-Ala binding to BSA (rmax of 0.90) and S-Wrf binding to BSA (rmax of 0.55), and r reached 3.16 for S-Wrf binding to pig serum albumin. The binding curves were analyzed with multiple binding models that include specific and nonspecific binding sites. We treated the binding sites with the intrinsic dissociation constant (Kd) smaller than or moderately larger than the largest [L]f value obtained ([L]fmax) as specific binding sites. Ligand binding sites with the Kd much larger than [L]fmax are treated as nonspecific sites. Because the amounts of ligand bound to nonspecific sites increase in proportion to [L]f, the increase in r due to the binding to nonspecific sites can be collectively expressed by a single term of a[L]f in the binding equation, where a is the summation of 1/Kd of all the nonspecific binding sites. For simplicity, we supposed that allosteric interaction between binding sites is not substantial. Table 1 lists all the binding equations used to analyze the binding curves. Data fitting was performed using Microsoft Excel and an in-house program written in Visual Basic for Application (Microsoft), some of them are shown in Supporting Information.
Table 1. Binding Models and Their Corresponding Binding Equations.a,b,c.
| binding model | binding equation |
|---|---|
| (n, Kd, a) | r = n[L]f/(Kd + [L]f) + a[L]f |
| (n, Kd) | r = n[L]f/(Kd + [L]f) |
| (1, Kd, a) | r = [L]f/(Kd + [L]f) + a[L]f |
| (1, Kd) | r = [L]f/(Kd + [L]f) |
| (2, Kd1, Kd2, a) | r = [L]f/(Kd1 + [L]f) + [L]f/(Kd2 + [L]f) + a[L]f |
| (2, Kd1, Kd2) | r = [L]f/(Kd1 + [L]f) + [L]f/(Kd2 + [L]f) |
| (2, Kd, a) | r = 2[L]f/(Kd + [L]f) + a[L]f |
| (2, Kd) | r = 2[L]f/(Kd + [L]f) |
| (3, Kd1, Kd2, Kd3, a) | r = [L]f/(Kd1 + [L]f) + [L]f/(Kd2 + [L]f) + [L]f/(Kd3 + [L]f) + a[L]f |
| (3, Kd1, Kd2, Kd3) | r = [L]f/(Kd1 + [L]f) + [L]f/(Kd2 + [L]f) + [L]f/(Kd3 + [L]f) |
| (3, Kd, a) | r = 3[L]f/(Kd + [L]f) + a[L]f |
| (3, Kd) | r = 3[L]f/(Kd + [L]f) |
[L]f is the free ligand concentration; r is the average number of the bound ligand molecules per protein molecule; Kd and Kdi (i = 1, 2, 3) are the intrinsic dissociation constants for the primary, secondary, and tertiary binding sites.
The term a[L]f denotes the binding to nonspecific binding sites.
Binding models are named by listing the total number of specific binding sites, their Kd, and the coefficient a when nonspecific binding exists, in parentheses.
Results and Discussion
Validation of Microbore FGC
Nichol et al. injected 60 mL of a BSA-MO mixture into a Sephadex G-50 column (1 cm × 38 cm, bed volume 30 mL) to verify the applicability of FGC to multiple binding systems.19 We therefore examined this BSA-MO binding system to validate microbore FGC. As shown in Figure 4a, in the absence of BSA, MO eluted at volumes (>60 μL) more than 3-fold larger than the column bed volume (19.2 μL), and all the chromatograms had a single plateau. MO eluted faster as its concentration increased. These features indicate significant reversible interactions between MO and the gel materials of TSKgel SuperSW2000, as observed for MO and Sephadex G-50.19 The absorbance in the plateau region was proportional to the MO concentration (inset in Figure 4a). In addition, we could reproduce similar chromatograms to those observed on the supposition that MO interacts reversibly with a finite number of binding sites on the gel matrix (Figure S4).
In the case of BSA-MO mixtures, the MO elution exhibited two plateaus (p1 and p2 in Figure 4b). The center of the boundary between plateaus p1 and p2 was independent of the MO concentration of the mixtures, indicating that free BSA and BSA-MO complexes migrated at the same speed, satisfying the condition (1) of FGC. Three series of FGC experiments including those shown in Figure 4b were performed on different days, and a total of 54 MO-BSA mixtures were analyzed. All the data are plotted on Figure 4c. The binding curve showed no tendency to level off, and an rmax of 1.36 was obtained at [L]f of 257 μM, suggesting the presence of more than two specific binding sites. Fitting to the (n, Kd, a) model (Table 1) gave an n value of 2.66 ± 0.24. Therefore, we fitted the data to (3, Kd1, Kd2, Kd3, a) and (3, Kd1, Kd2, Kd3) models, and in both the models, theoretical curve fitted to the data only when Kd1 = Kd2 = Kd3, suggesting that three equivalent binding sites exist. The theoretical binding curve drawn in Figure 4c is r = 3[L]f/(447 + [L]f) + 0.000938[L]f.
The binding of MO to BSA has been measured by equilibrium dialysis.21,28 The plot of r/[L]f versus r is linear, and the binding parameters of Kd and n are estimated to be 280 μM and 16, respectively.28 The large discrepancy in the number of the specific binding sites between the present study (n = 3) and the previous report (n = 16) is quite unexpected. To find the reason why this large discrepancy occurs, further experiments are necessary using different methods such as UV–vis spectroscopic titration, isothermal titration calorimetry, and native mass spectrometry. Interestingly, in the case of MO binding to HSA, it is reported that there are two specific binding sites for MO.29 Therefore, it is also important to compare the MO biding to various vertebrate serum albumins using the present FGC method. At present, the crystal structure of albumin complexed with MO has not been reported.
Binding of Dabsyl Amino Acids by BSA
Out of 20 proteinogenic amino acids, only tryptophan is known to bind to a single primary binding site on serum albumin with moderate affinity.30,31 Importantly, Sudlow et al. found that dansyl amino acids bind to one or two primary binding sites of HSA,32 suggesting that the interaction of the dansyl moiety with HSA drives the binding of dansyl amino acids to HSA. In fact, Doody et al. showed that both HSA and BSA have one major binding site for dansyl acid and one minor site.33 Based on these facts, we hypothesized that dabsyl amino acids (Figure 2) bind to the MO binding sites on BSA through the dabsyl group. Figure 5 shows the binding curves for Dabs-Gly, Dabs-l-Ala, and Dabs-d-Ala. Only the binding of Dabs-Gly exhibited a tendency to saturation, and an rmax of 1.5 was obtained at [L]f of 211 μM. Both the model (2, Kd1, Kd2) and (2, Kd) showed a satisfactory fit to the binding data, and the former model fit to the data only when Kd1 = Kd2, suggesting that two equivalent binding sites exist for Dabs-Gly. On the other hand, both the binding curves for Dabsyl-L- and d-Ala fitted well to the binding model of (3, Kd1, Kd2, Kd3) when Kd1 = Kd2. The Kd1 value for Dabsyl-L- and d-Ala was 157 ± 16 and 92 ± 12 μM, respectively, indicating that Dabsyl-d-Ala binds to the primary sites 1.7-fold stronger than Dabsyl-l-Ala. Interestingly, as for the binding to the secondary binding site, Dabsyl-l-Ala (Kd2 of 256 μM) binds 1.5 stronger than Dabsyl-d-Ala (Kd2 of 393 μM). These results suggest that each of the three primary MO binding sites has distinct mechanisms to accept the amino acid moiety of dabsyl amino acids.
Figure 5.
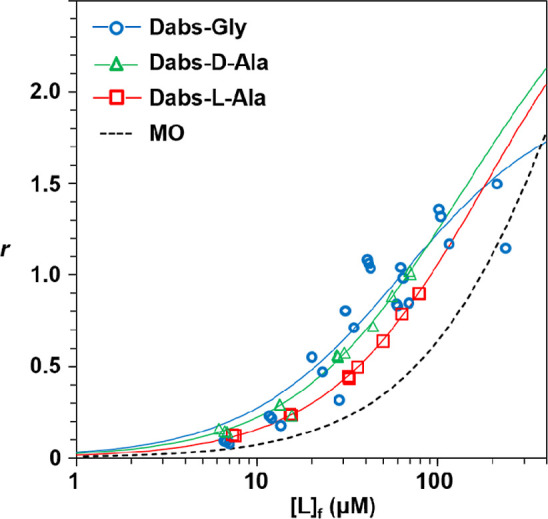
Binding of dabsyl amino acids by BSA. FGC was performed in 50 mM HEPES buffer (pH 7.5, I = 0.15) at 25 °C using a TSKgel SuperSW2000 column (0.7 mm × 50 mm) as described for the MO binding. The concentrations of the BSA–ligand mixtures are listed in Table S1. Blue line, r = 2[L]f/(63.3 + [L]f); red line, r = 2[L]f/(157 + [L]f) + [L]f/(256 + [L]f); green line, r = 2[L]f/(92 + [L]f) + [L]f/(393 + [L]f); and dotted line, r = 3[L]f/(447 + [L]f) + 0.000938[L]f.
Dabsyl amino acids absorb visible light very strongly (around 470 nm), whereas most drug molecules are colorless. Therefore, competition between a colorless drug and dabsyl amino acid for a binding site can be examined using a buffer containing the drug. If the competition occurs, then the second plateau of mFGC chromatogram increases because the concentration of free dabsyl amino acid increases compared to that in the absence of the drug. The site specificity of dansyl amino acids such as dansyl-l-asparagine (site I marker) and dansyl-l-phenylalanine (site II marker) has been well established by the crystallographic study of HSA complexed with these dansyl amino acids.34 Therefore, we are now systematically examining the site specificity of each dabsyl amino acid using site-specific dansyl amino acids and drugs as site markers.
Binding of Warfarin Enantiomers by HSA
Warfarin (Wrf) is an inhibitor of vitamin K epoxide reductase35 and is used widely as an anticoagulant. HSA binds Wrf and affects its pharmacokinetics significantly. Therefore, HSA-Wrf interaction has been intensively investigated using various methods.22,36−43 In most of these studies, racemic Wrf was used for binding study. Miller and Smail reported that HSA binds S-Wrf (Kd = 1.8 μM) slightly stronger than R-Wrf (Kd = 4.0 μM).36 Loun and Hage found that S-Wrf binds to an immobilized HSA stronger than R-Wrf.40 To confirm this enantioselectivity, we investigated in detail S- and R-Wrf binding to HSA.
First, we compared the performance of a Superdex Peptide column (1.0 mm × 75 mm, particle size 13 μm, exclusion limit 7 kDa) and a TSKgel SuperSW2000 (1.0 mm × 50 mm, particle size 4 μm, pore size 12.5 nm, exclusion limit 150 kDa) in microbore FGC by analyzing a mixture containing 65 μM S-Wrf and 33.2 μM HSA repeatedly. The results are shown in Figure 6. The reproducibility of the chromatograms was satisfactory for both columns. The boundary between the p1 and p2 plateaus corresponded to the trailing boundary of HSA in all the chromatograms. The free Wrf concentration [L]f was obtained to be 31.7 ± 0.2 μM (6 replicates) and 31.2 ± 0.3 μM (5 replicates) by FGC on the Superdex Peptide and TSKgel SuperSW2000 columns, respectively. The corresponding r values were 1.00 and 1.02, respectively. Because the TSKgel SuperSW2000 column produced sharper and wider plateaus compared to the Superdex Peptide column, the interaction between HSA and S- and R-Wrf was further investigated using this column.
Figure 6.

Reproducibility of FGC chromatograms of mixtures containing 33.2 μM HSA and 65 μM S-warfarin. All the samples were prepared in 300 μL. FGC was performed at 25 °C in 50 mM HEPES buffer (pH 7.5, I = 0.15). (a) Chromatograms obtained using a Superdex Peptide column (1.0 mm × 75 mm, bed volume 58.9 μL, particle size 13 μm, exclusion limit 7 kDa). Injection volume, 100 μL; flow rate, 10 μL/min. Chromatograms from 6 repeated injections are superimposed (red lines). Black lines, 33.2 μM HSA solution (3 replicates); blue lines, 65 μM S-Wrf solution (4 replicates). (b) Chromatograms obtained using a TSKgel SuperSW2000 column (1.0 mm × 50 mm, bed volume 39.3 μL, particle size 4 μm, pore size 12.5 nm, exclusion limit 150 kDa). Injection volume, 104 μL; flow rate, 8.0 μL/min. Red lines, HSA-S-War mixtures (5 replicates); black lines, 33.2 μM HSA (2 replicates); and blue lines, 65 μM S-War (3 replicates).
Figure 7 shows the binding data as the r vs [L]f plot. In both enantiomers, the r value continuously increased with increasing [L]f, showing no tendency to level off. The maximal r value obtained (rmax) for S- and R-Wrf was 2.65 and 2.62, respectively. In the concentration range of 0.4–10 μM, the r value for S-Wrf (blue circle) was slightly larger than that for R-Wrf (red square). On the other hand, in the concentration range of 10–100 μM, the r value for R-Wrf was slightly larger than that for S-Wrf. As expected from these binding features, the (2, Kd1, Kd2, a) model (Table 1) gave satisfactory fit to those binding data (lines drawn in Figure 7). The intrinsic dissociation constant of the primary site (Kd1) for S- and R-Wrf was 6.36 ± 0.44 and 8.67 ± 0.91 μM, respectively, whereas that of the secondary site (Kd2) for S- and R-Wrf was 88.7 ± 8.7 and 38.9 ± 5.2 μM, respectively, Both S- and R-Wrf showed similar levels of nonspecific binding to HSA as judged by the respective a value of 0.00357 and 0.00305 μM–1. The results reported previously for the binding of racemic Wrf to HSA at pH 6.1 using equilibrium dialysis suggested that one primary site with Kd1 = 2.08 μM and a secondary site with Kd2 = ∼50 μM,44 consistent with the present results. Crystal structural analysis of HSA-S-Wrf and HSA-R-Wrf complexes has revealed that both enantiomers bind to the same primary site in subdomain IIA in a similar way.45 In addition to this site, a secondary binding site is found in subdomain IB, where only an electron density with the coumarin size is observed,45 consistent with the best-fit model in which one secondary binding site exists. Loun and Hage reported that S-Wrf binds to the immobilized HSA (HSA column) 1.3-fold stronger than R-Wrf and that the binding capacity of the HSA column for R-Wrf is 1.4-fold larger than that for S-Wrf.40 The present results are consistent with these results.
Figure 7.

Binding of S- and R-warfarin by HSA. FGC was performed at 25 °C in 50 mM HEPES buffer (pH 7.5, I = 0.15) using a TSKgel SuperSW2000 column (1.0 × 75 mm). Injection volume, 90 μL; flow rate, 10 μL/min. The average number of the bound ligand per HSA molecule (r) was plotted against the free Wrf concentration. Blue line, r = [L]f/(6.36 + [L]f) + [L]f/(88.7 + [L]f) + 0.00357[L]f.; red line, r = [L]f/(8.67 + [L]f) + [L]f/(38.9 + [L]f) + 0.00305[L]f.
Binding of S-Warfarin to Rat, Pig, Rabbit, and BSA
Rats, pigs, cows, and rabbits are often used for scientific experiments. Because Wrf binding to serum albumin strongly affects its pharmacokinetics, to translate findings obtained by animal experiments into the pharmacology of Wrf in human, it is essential to know the binding behavior of each albumin for Wrf. However, Wrf binding to albumin of these animals has been rarely investigated. Therefore, using microbore FGC, we compared S-Wrf binding to these albumins (Figure 8). We have found that all serum albumins except pig albumin have a single primary binding site for S-Wrf, while pig albumin has two equivalent primary binding sites. The Kd1 value of each albumin is as follows: rat, 1.34 ± 0.05 μM; pig, 11.9 ± 0.5 μM; rabbit, 37.7 ± 8.3 μM; and BSA, 258 ± 3 μM. The rat Kd1 value is consistent with that obtained previously with equilibrium dialysis (1.1 μM).46 The primary binding site of rat albumin has about 200-hold higher affinity with S-Wrf than that of BSA. Using the crystal structure of HSA-S-Wrf complex (PDB ID 1ha2) as a guide, we compared the amino acid sequence of subdomain IIA of these 5 serum albumins. Only in the BSA sequence, Arg222 of HSA is replaced by lysine. Serum albumins of chicken, ovine, and caprine have Lys222 as BSA. To examine the possible impact of this replacement on the warfarin affinity, it is important to obtain the S-Wrf binding data for chicken, ovine, and caprine albumins. Crystal structures of BSA and rabbit have been determined,4 but there are no reports on those of rat and mouse serum albumin. Computer simulation of the binding mode of S-Wrf with HSA, BSA, and rabbit serum albumin may reveal the structural base of the large species-dependent difference in S-Wrf affinity. In this context, recent high-resolution crystal structures of animal serum albumins show that the location and the number of drug binding sites vary greatly from species to species.5−7 For example, although sheep and goat serum albumins show 98% amino acid sequence similarity, the former has two binding sites for the drug 3,5-diiodosalicylic acid, while the latter has 6 sites for the drug, revealing species-dependent changes in the conformation of side chains in binding pockets and in the volume of binding cavity.5 Similar results have been found for the binding of diclofenac, a nonsteroidal anti-inflammatory drug, to these ruminant albumins and rabbit albumin.7 Hence, it is difficult to extrapolate the binding properties of one species to another.
Figure 8.

S-Warfarin binding with rat, pig, rabbit, and bovine serum albumins. FGC was performed in 50 mM HEPES buffer (pH 7.5, I = 0.15) at 25 °C as described for the binding of Wrf with HSA. Broken line is the theoretical curve for S-Wrf binding to HSA (blue line in Figure 7). The concentrations of albumin and S-wrf mixtures used are listed in Table S1.
Conclusions
FGC was improved to be applicable for 100 μL sample consumption by using a microbore gel filtration column and a chromatographic system specially arranged for microbore FGC. Although the sample consumption is still too large to be applicable for various binding systems, the present FGC is demonstrated to be useful for the investigation of the interaction of serum albumins with small molecules. All the binding parameters obtained in the present study are summarized in Table 2.
Table 2. Binding Models Best-Fit to the Binding Curves Obtained by Microbore FGCa.
| albumin | ligand | model | binding parameters |
|---|---|---|---|
| HSA | R-Wrf | (2, Kd1, Kd2, a) | Kd1 = 8.67 ± 0.91 μM Kd2 = 38.9 ± 5.2 μM a = 0.00305 ± 0.00021 μM–1 |
| HSA | S-Wrf | (2, Kd1, Kd2, a) | Kd1 = 6.36 ± 0.44 μM Kd2 = 88.7 ± 8.7 μM a = 0.00357 ± 0.00021 μM–1 |
| BSA | S-Wrf | (2, Kd1, Kd2) | Kd1 = 258 ± 3 μM Kd2 = 690 ± 3 μM |
| pig | S-Wrf | (2, Kd, a) | Kd = 11.9 ± 0.5 μM a = 0.00351 ± 0.00010 μM–1 |
| rabbit | S-Wrf | (2, Kd1, Kd2, a) | Kd1 = 37.7 ± 8.3 μM Kd2 = 277 ± 137 μM a = 0.00156 ± 0.00038 μM–1 |
| rat | S-Wrf | (2, Kd1, Kd2, a) | Kd1 = 1.34 ± 0.05 μM Kd2 = 128 ± 93 μM a = 0.00834 ± 0.00395 μM–1 |
| BSA | MO | (3, Kd, a) | Kd = 447 ± 18 μM a = 0.000938 ± 0.000143 μM–1 |
| BSA | Dabs-Gly | (2, Kd) | Kd = 63.3 ± 4.7 μM |
| BSA | Dabs-l-Ala | (3, Kd1, Kd2, Kd3) | Kd1 = 157 ± 16 μM Kd2 = 157 ± 16 μM Kd3 = 256 ± 45 μM |
| BSA | Dabs-d-Ala | (3, Kd1, Kd2, Kd3) | Kd1 = 92 ± 12 μM Kd2 = 92 ± 12 μM Kd3 = 393 ± 142 μM |
All the binding data were obtained at 25 °C and in 50 mM HEPES buffer (pH 7.5, ionic strength = 0.15) by microbore FGC. MO, methyl orange; Wrf, warfarin.
Simulation of FGC using a capillary gel filtration column by the present program (Supporting Information) suggests that sample consumption can be reduced to 1–10 μL levels. It is not difficult to pack porous gels into a capillary column. Prevention of the widening of the boundaries of p1 and p2 in the dead space in the tube and flow cell is more difficult but can be technically attainable. The most important key factor of capillary FGC is the interaction of ligands with the gel matrix. As shown in Figure S3, the width of p2 is equal to the internal volume of the column (Vi) in the absence of the matrix–ligand interaction, and it increases as the interaction increases. Therefore, moderate levels of the matrix–ligand interaction can counter the widening of p2 to result in p2 with sufficient width to obtain [L]f. To control the matrix–ligand interaction to be suitable for FGC, it is necessary to understand the mechanism of the interaction using the recent comprehensive approach.47
Supporting Information Available
The Supporting Information is available free of charge at https://pubs.acs.org/doi/10.1021/acsomega.4c07939.
Verification of [L]p2 = [L]f; effects of ligand interaction with gel materials on ligand elution profiles; simulation program of microbore FGC; and curve fitting program (PDF)
Author Present Address
∥ Department of Nutrition, Koshien University,10–1 Momijigaoka, Takarazuka, Hyogo 665–0006, Japan
Author Contributions
The manuscript was written through the contributions of all the authors. All authors have approved the final version of the manuscript.
This work was supported by JSPS KAKENHI Grant Numbers JP18590528, JP25460684.
The authors declare no competing financial interest.
Supplementary Material
References
- López-Yerena A.; Perez M.; Vallverdú-Queralt A.; Escribano-Ferrer E. Insights into the binding of dietary phenolic compounds to human serum albumin and food-drug interactions. Pharmaceutics 2020, 12, 1123. 10.3390/pharmaceutics12111123. [DOI] [PMC free article] [PubMed] [Google Scholar]
- Cunha R. S. d.; Azevedo C. A. B.; Falconi C. A.; Ruiz F. F.; Liabeuf S.; Carneiro-Ramos M. S.; Stinghen A. E. The interplay between uremic toxins and albumin, membrane transporters and drug interaction. Toxins 2022, 14, 177. 10.3390/toxins14030177. [DOI] [PMC free article] [PubMed] [Google Scholar]
- Zhao L.; Teng M.; Zhao X.; Li Y.; Sun Y.; Zhao W.; Ruan Y.; Leung K. M. Y.; Wu F. Insight into the binding model of per- and polyfluoroalkyl substances to proteins and membranes. Environ. Int. 2023, 175, 107951. 10.1016/j.envint.2023.107951. [DOI] [PubMed] [Google Scholar]
- Majorek K. A.; Porebski P. J.; Dayal A.; Zimmerman M. D.; Jablonska K.; Stewart A. J.; Chruszcz M.; Minor W. Structural and immunologic characterization of bovine, horse, and rabbit serum albumins. Mol. Immunol. 2012, 52, 174–182. 10.1016/j.molimm.2012.05.011. [DOI] [PMC free article] [PubMed] [Google Scholar]
- Bujacz A.; Talaj J. A.; Zielinski K.; Pietrzvk-Brzezinska A. J.; Neumann P. Crystal structures of serum albumins from domesticated ruminants and their complexes with 3,3-diiodosalicylic acid. Acta Crystallogr. 2017, D52, 896–909. 10.1107/S205979831701470X. [DOI] [PMC free article] [PubMed] [Google Scholar]
- Czub M. P.; Stewart A. J.; Shabalin I. G.; Minor W. Organism-specific differences in the binding of ketoprofen to serum albumin. IUCrJ. 2022, 9, 551–561. 10.1107/S2052252522006820. [DOI] [PMC free article] [PubMed] [Google Scholar]
- Talaj J. A.; Zielinski K.; Bujacz A. Structural investigation of diclofenac binding to ovine, caprine, and leporine serum albumins. Int. J. Mol. Sci. 2023, 24, 1534. 10.3390/ijms24021534. [DOI] [PMC free article] [PubMed] [Google Scholar]
- Curry S. Lessons from the crystallographic analysis of small molecule binding to human serum albumin. Drug Metab. Pharmacokinet. 2009, 24, 342–357. 10.2133/dmpk.24.342. [DOI] [PubMed] [Google Scholar]
- Wang Y.; Yu H.; Shi X.; Luo Z.; Lin D.; Huang M. Structural mechanism of ring-opening reaction of glucose by human serum albumin. J. Biol. Chem. 2013, 288, 15980–15987. 10.1074/jbc.M113.467027. [DOI] [PMC free article] [PubMed] [Google Scholar]
- Park J.; Kim M.-S.; Park T.; Kim Y. H.; Shin D. H. Crystal structure of pharmaceutical-grade human serum albumin. Int. J. Biol. Macromol. 2021, 166, 221–228. 10.1016/j.ijbiomac.2020.10.152. [DOI] [PubMed] [Google Scholar]
- Klotz I. M.; Hunston D. Protein interactions with small molecules. Relationships between stoichiometric binding constants, site binding constants and empirical binding parameters. J. J. Biol. Chem. 1975, 250, 3001–3009. 10.1016/S0021-9258(19)41586-X. [DOI] [PubMed] [Google Scholar]
- Klotz I. M.; Hunston D. J. Protein affinities for small molecules: conceptions and misconceptions. Arch. Biochem. Biophys. 1979, 193, 314–328. 10.1016/0003-9861(79)90036-5. [DOI] [PubMed] [Google Scholar]
- Brodersen R.; Nielsen F.; Christiansen J. C.; Andersen K. Characterization of binding equilibrium data by a variety of fitted isotherms. Eur. J. Biochem. 1987, 169, 487–495. 10.1111/j.1432-1033.1987.tb13636.x. [DOI] [PubMed] [Google Scholar]
- Tamara S.; den Boer M. A.; Heck A. J. R. High-resolution native mass spectrometry. Chem. Rev. 2022, 122, 7269–7326. 10.1021/acs.chemrev.1c00212. [DOI] [PMC free article] [PubMed] [Google Scholar]
- Fiorentino F.; Rotili D.; Mai A. Native mass spectrometry-directed drug discovery: recent advances in investigating protein function and modulation. Drug Discovery Today 2023, 28, 103548. 10.1016/j.drudis.2023.103548. [DOI] [PubMed] [Google Scholar]
- Gilbert G. A.; Jenkins R. C. Ll. Sedimentation and electrophoresis of interacting substances II. Asymptotic boundary shape for two substances interacting reversibly. Proc. R. Soc. A 1959, 253, 420–437. 10.1098/rspa.1959.0204. [DOI] [Google Scholar]
- Nichol L. W.; Winzor D. J. The determination of equilibrium constants from transport data on rapidly reacting systems of the type A + B = C. J. Phys. Chem. 1964, 68, 2455–2463. 10.1021/j100791a012. [DOI] [Google Scholar]
- Cooper P. F.; Wood G. C. Protein-binding of small molecules: new gel filtration method. J. Pharm. Pharmac. 1968, 20, 150S–156S. 10.1111/j.2042-7158.1968.tb09877.x. [DOI] [PubMed] [Google Scholar]
- Nichol L. W.; Jackson W. J. H.; Smith G. D. The binding of methyl orange to bovine serum albumin studied by frontal analysis in Sephadex chromatography. Arch. Biochem. Biophys. 1971, 144, 438–439. 10.1016/0003-9861(71)90497-8. [DOI] [PubMed] [Google Scholar]
- Nishimura N.; Janado M. Gel electrophoresis of amylase in the presence of sodium dodecyl sulfate. J. Biochem. 1975, 77, 421–426. 10.1093/oxfordjournals.jbchem.a130741. [DOI] [PubMed] [Google Scholar]
- Morris M. J.; Brown J. R. Estimation of the plasma protein binding of drugs by size exclusion chromatography at medium pressure (150 lb in–2: 1.03 MPa). J. Pharm. Pharmac. 1977, 29, 642–644. 10.1111/j.2042-7158.1977.tb11425.x. [DOI] [PubMed] [Google Scholar]
- Honjo M.; Ishida T.; Horiike K. Semi-micro-scale frontal gel chromatography of interaction systems of a protein and small molecules: binding of warfarin, tryptophan, or FMN to albumin, and o-nitrophenol to catechol 2,3-dioxygenase. J. Biochem. 1997, 122, 258–263. 10.1093/oxfordjournals.jbchem.a021747. [DOI] [PubMed] [Google Scholar]
- Sawada O.; Ishida T.; Horiike K. Frontal gel chromatographic analysis of the interaction of a protein with self-associating ligands: aberrant saturation in the binding of flavins to bovine serum albumin. J. Biochem. 2001, 129, 899–907. 10.1093/oxfordjournals.jbchem.a002935. [DOI] [PubMed] [Google Scholar]
- Ishida T.Frontal gel filtration. In Advanced Methods in Structural Biology. Springer Protocols Handbooks; Senda T., Maenaka K., Eds.; Springer Japan: Tokyo, 1996, pp 199–226. [Google Scholar]
- Pace C. N.; Vajdos F.; Fee L.; Grimsley G.; Gray T. How to measure and predict the molar absorption coefficient of a protein. Protein Sci. 1995, 4, 2411–2423. 10.1002/pro.5560041120. [DOI] [PMC free article] [PubMed] [Google Scholar]
- West B. D.; Preis S.; Schroeder C. H.; Link K. P. Studies on the 4-hydroxycoumarins. XVII. The resolution and absolute configuration of warfarin. J. Am. Chem. Soc. 1961, 83, 2676–2679. 10.1021/ja01473a020. [DOI] [Google Scholar]
- Lin J.-K.; Chang J.-Y. Chromophoric labeling of amino acids with 4-dimethylaminoazobenzene-4’-sulfonyl chloride. Anal. Chem. 1975, 47, 1634–1638. 10.1021/ac60359a007. [DOI] [PubMed] [Google Scholar]
- Shikama K. Denaturation and renaturation of binding sites of bovine serum albumin for methyl orange. J. Biochem. 1968, 64, 55–63. 10.1093/oxfordjournals.jbchem.a128862. [DOI] [PubMed] [Google Scholar]
- Ito S.; Yamamoto D. Structure of the methyl orange-binding site on human serum albumin and its color-change mechanism. Biomed. Res. (Tokyo) 2015, 36, 247–252. 10.2220/biomedres.36.247. [DOI] [PubMed] [Google Scholar]
- McMenamy R. H.; Lund C. C.; Oncley J. L. Unbound amino acid concentrations in human blood plasmas. J. Clin. Invest. 1957, 36, 1672–1679. 10.1172/JCI103568. [DOI] [PMC free article] [PubMed] [Google Scholar]
- McMenamy R. H.; Seder R. H. Thermodynamic values related to the association of L-tryptophan analogues to human serum albumin. J. Biol. Chem. 1963, 238, 3241–3248. 10.1016/S0021-9258(18)48653-X. [DOI] [PubMed] [Google Scholar]
- Sudlow G.; Birkett D. J.; Wade D. N. The characterization of two specific drug binding sites on human serum albumin. Mol. Pharmacol. 1975, 11, 824–832. 10.1016/S0026-895X(25)10691-3. [DOI] [PubMed] [Google Scholar]
- Doody M. C.; Gotto A. M.; Smith L. C. 5-(Dimethylamino)naphthalene-1-sulfonic acid, a fluorescent probe of the medium chain fatty acid binding site of serum albumin. Biochemistry 1982, 21, 28–33. 10.1021/bi00530a005. [DOI] [PubMed] [Google Scholar]
- Ryan A. J.; Ghuman J.; Zunszain P. A.; Chung C.-W.; Curry S. Structural basis of binding of fluorescent, site-specific dansylated amino acids to human serum albumin. J. Struct. Biol. 2011, 174, 84–91. 10.1016/j.jsb.2010.10.004. [DOI] [PMC free article] [PubMed] [Google Scholar]
- Shen G.; Cui W.; Zhang H.; Zhou F.; Huang W.; Liu Q.; Yang Y.; Li S.; Bowman G. R.; Sadler J. E.; Gross M. L.; Li W. Warfarin traps human vitamin K epoxide reductase in an intermediate state during electron transfer. Nat. Struct. Mol. Biol. 2017, 24, 69–76. 10.1038/nsmb.3333. [DOI] [PMC free article] [PubMed] [Google Scholar]
- Miller J. H. M.; Smail G. A. Interaction of the Enantiomers of Warfarin with Human Serum Albumin, Peptides and Amino Acids. J. Pharm. Pharmacol. 1977, 29, 33P. 10.1111/j.2042-7158.1977.tb11501.x. [DOI] [PubMed] [Google Scholar]
- Sebille B.; Thuaud N.; Tillement J.-P. Study of binding of low-molecular-weight ligand to biological macromolecules by high-performance liquid chromatography. Evaluation of binding parameters for two drugs bound to human serum albumin. J. Chromatogr. 1978, 167, 159–170. 10.1016/S0021-9673(00)91155-5. [DOI] [PubMed] [Google Scholar]
- Pinkerton T. C.; Koeplinger K. Determination of warfarin-human serum albumin protein binding parameters by an improved Hummel-Dreyer high-performance liquid chromatographic method using internal surface reversed-phase columns. A. Anal. Chem. 1990, 62, 2114–2122. 10.1021/ac00218a013. [DOI] [PubMed] [Google Scholar]
- Vorum H.; Fisker K.; Brodersen R. High-affinity binding of two molecules of warfarin and phenprocoumon to human serum albumin. Biochim. Biophys. Acta 1994, 1205, 178–182. 10.1016/0167-4838(94)90231-3. [DOI] [PubMed] [Google Scholar]
- Loun B.; Hage D. S. Chiral separation mechanisms in protein-based HPLC columns. 1. Thermodynamic studies of (R)- and (S)-warfarin binding to immobilized human serum albumin. Anal. Chem. 1994, 66, 3814–3822. 10.1021/ac00093a043. [DOI] [PubMed] [Google Scholar]
- Yamasaki K.; Maruyama T.; Kragh-Hansen U.; Otagiri M. Characterization of site I on human serum albumin: concept about the structure of a drug binding site. Biochim. Biophys. Acta 1996, 1295, 147–157. 10.1016/0167-4838(96)00013-1. [DOI] [PubMed] [Google Scholar]
- Ha C.-H.; Petersen C. E.; Park D. S.; Harohalli K.; Bhagavan N. V. Investigations of the effects of ethanol on warfarin binding to human serum albumin. J. Biomed. Sci. 2000, 7, 114–121. 10.1007/BF02256617. [DOI] [PubMed] [Google Scholar]
- Olsen H.; Andersen A.; Nordbø A.; Kongsgaard U. E.; Børmer O. P. Pharmaceutical-grade albumin: impaired drug-binding capacity in vitro. BMC Clin. Pharmacol. 2004, 4, 4. 10.1186/1472-6904-4-4. [DOI] [PMC free article] [PubMed] [Google Scholar]
- Wilting J.; van der Giesen W. F.; Janssen L. H. M.; Weideman M. M.; Otagiri M.; Perrin J. The effect of albumin conformation on the binding of warfarin to human serum albumin: the dependence of the binding of warfarin to human serum albumin on the hydrogen, calcium, and chloride ion concentrations as studied by circular dichroism, fluorescence, and equilibrium dialysis. J. Biol. Chem. 1980, 255, 3032–3037. 10.1016/s0021-9258(19)85847-7. [DOI] [PubMed] [Google Scholar]
- Petitpas I.; Bhattacharya A. A.; Twine S.; East M.; Curry S. Crystal structure analysis of warfarin binding to human serum albumin. Anatomy of frug site I. J. Biol. Chem. 2001, 276, 22804–22809. 10.1074/jbc.M100575200. [DOI] [PubMed] [Google Scholar]
- Hervé F.; Rajkowski K.; Martin M. T.; Dessen P.; Cittanova N. Drug-binding properties of rat α-foetoprotein: binding of warfarin, phenylbutazone, diazepam, digitoxin and cholic acid. Biochem. J. 1984, 221, 401–406. 10.1042/bj2210401. [DOI] [PMC free article] [PubMed] [Google Scholar]
- Gan N.; Song Y.; Li Y.; Liu P.; Chen S.; He Y.; Zeng T.; Wang W.; Wu D. Characterization of the effects of bridging linker on the β-lactoglobulin binding mechanism on the nanoscale metal-organic frameworks. Food Chem. 2025, 464, 141715. 10.1016/j.foodchem.2024.141715. [DOI] [PubMed] [Google Scholar]
Associated Data
This section collects any data citations, data availability statements, or supplementary materials included in this article.