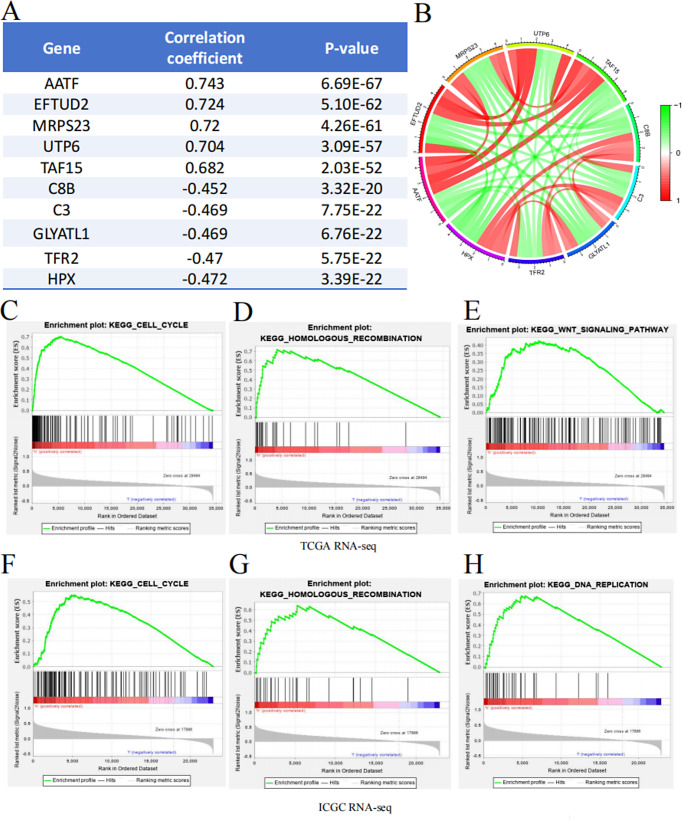
Fig. 6.
Co-Expression and GSEA Enrichment Analysis of DNAJC7. A summary table lists the top five genes with the strongest synergistic or antagonistic expression relationships with DNAJC7. (B) Visualization of the top five genes showing synergistic or antagonistic expression patterns with DNAJC7. GSEA enrichment analysis results based on TCGA RNA-seq. (C) Cell Cycle; (D) Homologous Recombination; (E) WNT Signaling Pathway. GSEA enrichment analysis results based on ICGC RNA-seq. (F) Cell Cycle; (G) Homologous Recombination; (H) DNA Replication

