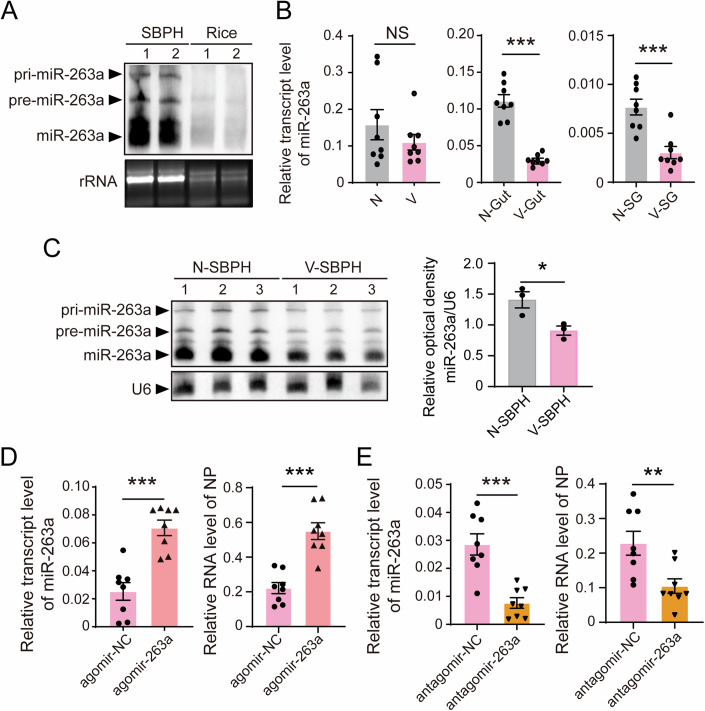
Figure 1. MiR-263a benefits RSV accumulation in SBPH.
(A) Northern blot analysis for determining the existence of miR-263a in nonviruliferous SBPH and healthy rice leaves; the signal was detected using a biotin-labeled LNA oligonucleotide probe for miR-263a. rRNA from SBPHs and rice was used as an internal control. Each sample includes two replicates. (B) Relative transcript level of miR-263a in the whole bodies, guts, and salivary glands (SGs) of nonviruliferous (N) and viruliferous (V) SBPH quantified by qPCR. SBPH U6 snRNA was used as an endogenous control. Eight biological replicates were prepared, with each replicate consisting of 5 insect bodies, 8 guts, or 10 salivary glands. P values from left to right, P = 1.48E−05 , P = 4.00E−04. (C) Northern blot showing the transcipt levels of miR-263a in the whole bodies of nonviruliferous and viruliferous SBPHs. SBPH U6 snRNA was used as an internal control. Each sample includes three replicates. P = 0.0296. (D, E) Relative transcript level of miR-263a and the RNA level of viral NP in nonviruliferous fourth-instar SBPH larvae after injected with the mixture of RSV crude extractions and agomir-263a/agomir-NC (D), or the mixture of RSV crude extractions and antagomir-263a/antagomir-NC (E) for 4 d. SBPH U6 snRNA and EF2 were used as an endogenous control for miR-263a and viral NP, respectively. Eight biological replicates were prepared, with each replicate consisting of 5 insect bodies. P values from left to right, P = 9.67E−05, P = 5.80E−05, P = 2.00E−04, P = 0.0085. For (B) to (E), values are presented as mean ± SE and were compared using Student’s t test. NS, no significant difference. *P < 0.05. **P < 0.01. ***P < 0.001. Source data are available online for this figure.

