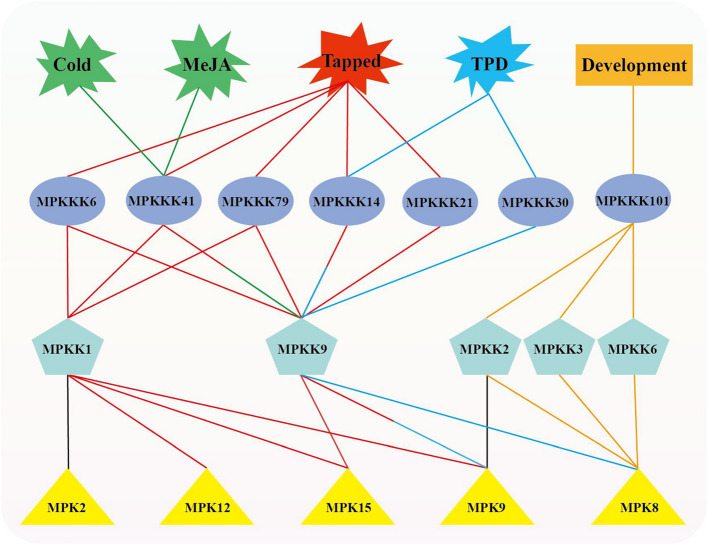
Fig. 7.
Interaction network of HbMPK cascade genes. The lines between HbMPK cascade genes represent their interactions. Different colors indicate induction under specific treatment conditions and potential biological responses: green lines represent induction by MeJA and cold treatment, red lines represent induction by tapped treatment, blue lines represent induction in TPD-affected trees, and orange lines represent potential involvement in the growth and development of rubber tree laticifers. Lines with two colors indicate involvement in multiple responses

