
FIGURE 2.
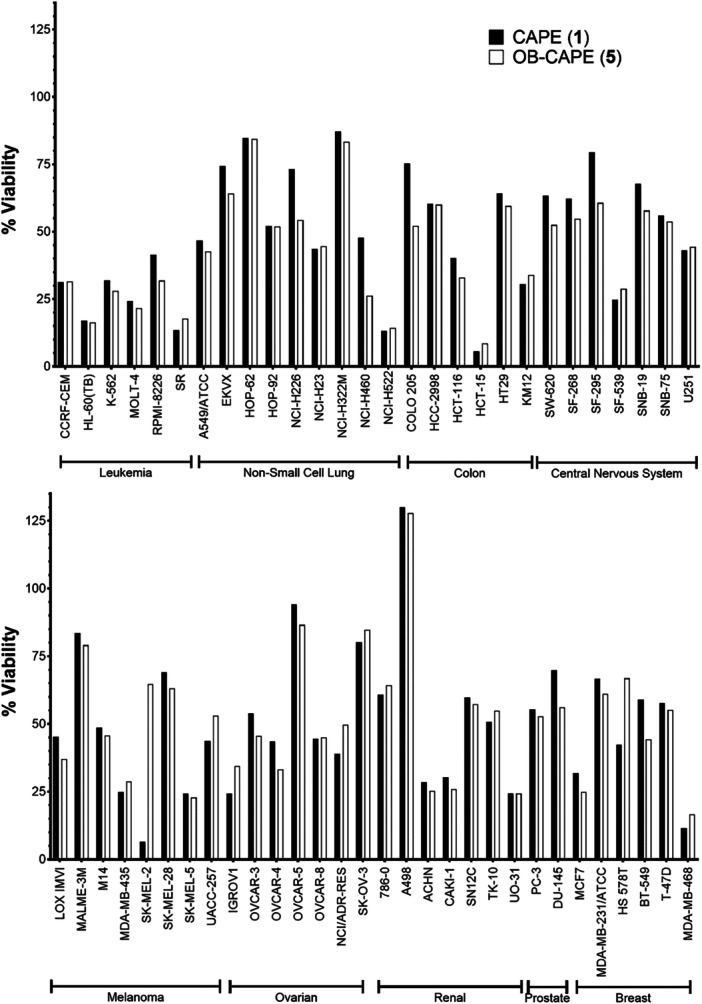
NCI60 Cancer cell score of CAPE (1) or OB‐CAPE (5) after exposure to a single dose (10 µM) of each compound compared to an untreated control. For each cancer cell line, viability results are presented as mean values of duplicate analyses.
Official websites use .gov
A
.gov website belongs to an official
government organization in the United States.
Secure .gov websites use HTTPS
A lock (
) or https:// means you've safely
connected to the .gov website. Share sensitive
information only on official, secure websites.
NCI60 Cancer cell score of CAPE (1) or OB‐CAPE (5) after exposure to a single dose (10 µM) of each compound compared to an untreated control. For each cancer cell line, viability results are presented as mean values of duplicate analyses.