
FIGURE 6.
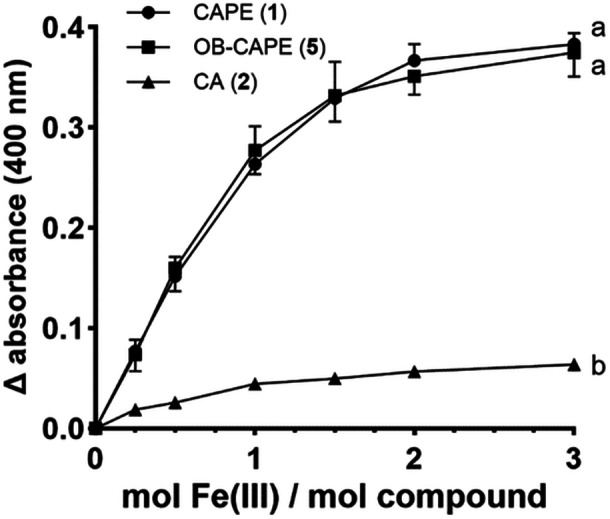
Absorbance ratios of compounds and Fe (III) adjusted to background signal of each respective compound at 400 nm. Data are represented as the mean ± SD of three independent experiments. For clarity, error bars for CAPE point upwards, whereas error bars for OB‐CAPE point downwards. Variation was small in CA samples, such that no error bars were generated. Two‐way ANOVA analysis with Tukey's multiple comparisons test was performed; curves that do not share a common letter are considered statistically different (p < 0.0001).