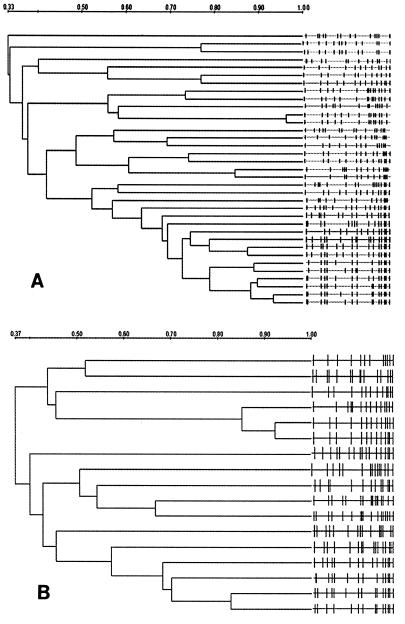
FIG. 1.
Dendrograms illustrating the relationship of S. aureus nasal isolates collected from MP (A) and NMP (B) and analyzed by PFGE. The right-hand sides of panels A and B illustrate the PFGE patterns for the individual isolates. The isolates were compared by use of the DC. Strains that were ≥70% similar were classified as related. One isolate from a member of the MP was unavailable for PFGE. Two isolates were from a single subject who was a member of the NMP. Note that the scales of the two panels differ.

