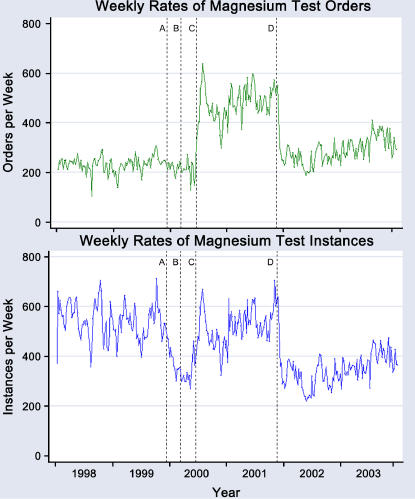
Figure 3.
Weekly rates of magnesium orders (top) and net instances (bottom) over the entire study period. Rates of instances and results track closely together and have an overall correlation coefficient of 0.87. Study-related events affecting ordering rates included implementation of the first decision support tool (A), removal of the first decision support tool (B), implementation of the second decision support tool (C), and replacement of the second decision support tool with the third (D). The change in rates at C brings net instances and results back to the preinterventions baseline. When corrected for increasing hospital admission rates, the apparent upward trend following D remains significant for net instances.

