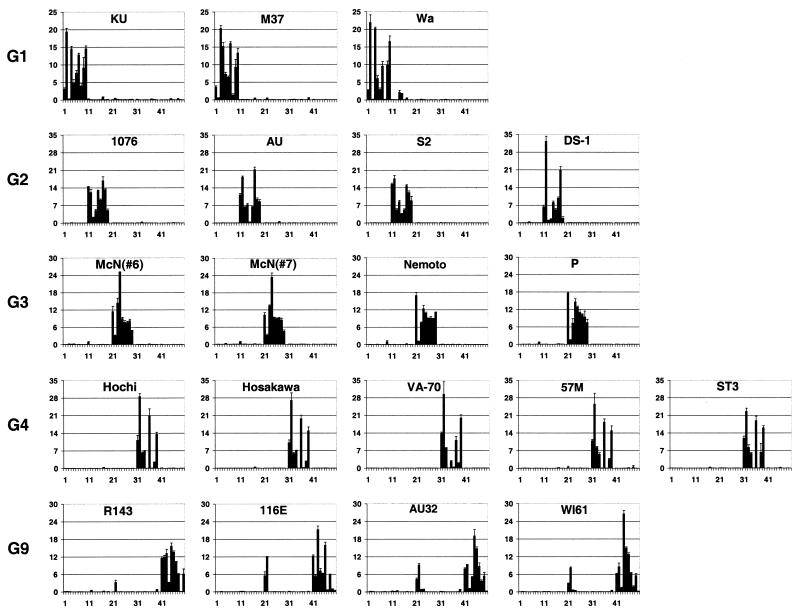
FIG. 4.
Quantitative fluorescence (Cy5) profiles of rotavirus microarrays. Normalized fluorescent signals from each oligonucleotide are shown on the y axis. Numbered locations of probes are shown on the x axis. All G1 genotype-specific oligonucleotides have numbers from 1 to 10, G2 genotype from 11 to 19, G3 genotype from 21 to 29, G4 genotype from 31 to 39, and G4 genotype from 41 to 50. All fluorescence data were obtained from two or three independent hybridizations on different microchips.

