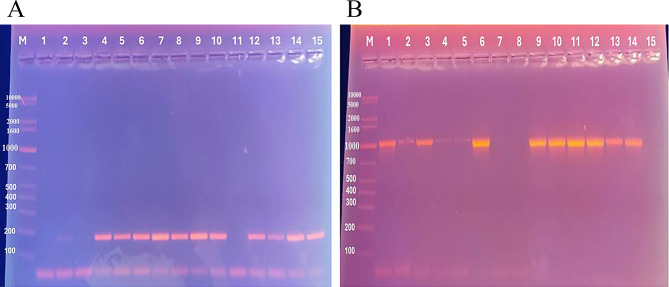
Fig. 3.
Agarose Gel Electrophoresis of PCR products for qacE∆1 and cepA Genes. Agarose Gel Electrophoresis Showing PCR Bands for qacE∆1 and cepA Genes. Lane M: DNA Molecular Size Marker (100 − 10,000 bp). (A): Agarose Gel Electrophoresis for qacE∆1 gene. Lanes 2, 4–10, and 12–15: Positive for qacE∆1 with a band size of 190 bp. Lanes 1, 3, and 11: Negative for qacE∆1. (B): Agarose Gel Electrophoresis for cepA gene. Lanes 1–6 and 9–14: Positive for cepA with a band size of 1050 bp. Lanes 7, 8, and 15: Negative for cepA

