



Abstract
Angiogenesis is a crucial step in tumor progression, including melanoma, making anti‐angiogenic strategies a widely explored treatment approach. However, both innate and acquired resistance to these therapies suggest that this approach may need re‐evaluation. Nanoparticles have gained attention for their potential to enhance drug delivery and retention within tumors via the bloodstream. However, the in vitro screening of nanoparticles is limited by the inability of preclinical models to replicate the complex tumor microenvironment, especially the blood supply. Here, it is demonstrated that melanoma cells embedded in Matrigel spheroids can engraft in and be vascularized by the chorioallantoic membrane (CAM) of fertilized chicken eggs. This model allows for the assessment of nanoparticle toxicity and accumulation in tumor spheroids, as well as functional effects such as angiogenesis. Cerium oxide nanoparticles (nanoceria) and their surface functionalized derivatives are widely explored for biomedical applications due to their ability to modulate oxidative stress and angiogenesis. Here, it is observed that heparin functionalized nanoceria penetrate melanoma spheroids in the CAM and promote spheroid vascularization to a greater extent than nanoceria alone. This study aids in the development of preclinical cancer models for nanoparticle screening and provides new insight into the interplay between nanoparticle surface coatings and biological effects.
Keywords: angiogenesis, cerium oxide, melanoma, nanoparticle, tumor spheroid
Melanoma cell spheroid engraftment is optimized in the chicken chorioallantoic membrane overcoming the complexity of other in vivo models. Using this model, greater penetration of cerium oxide nanoparticles (nanoceria) functionalized with heparin in spheroids is observed via enhancement of vascularization than nanoceria alone. This model promises a scalable, low‐cost platform for early preclinical therapy screening such as for precision medicine.

1. Introduction
Melanoma is an aggressive and lethal form of skin cancer, primarily due to its tendency for early metastasis[ 1 , 2 ] Treatment options for melanoma include surgical removal of the primary tumor, chemotherapy, radiation therapy, and immunotherapy.[ 3 , 4 ] However, melanoma is a heterogenous disease, often showing low response rates to these treatments in advanced stages due to inherent or acquired resistance.[ 5 , 6 ] This heterogeneity is exemplified by BRAF mutations being present in only half of patients with metastatic melanoma.[ 7 ] These challenges underscore the need for new treatment approaches for melanoma.[ 1 , 8 , 9 ]
Angiogenesis is a crucial step in the progression of melanoma to a malignant phenotype, making anti‐angiogenic strategies a widely explored treatment option.[ 10 ] However, both innate and acquired resistance to these therapies indicate that this approach may need re‐evaluation.[ 10 ] Nanoparticles have gained attention for their potential to revolutionize cancer treatment by enhancing drug delivery and retention within tumors compared to traditional methods.[ 11 ] Despite this, the tumor microenvironment can hinder effective drug delivery.[ 12 ] A functional blood supply within solid tumors aids in the delivery and accumulation of nanoparticles.[ 12 , 13 ] Therefore, regulating tumor vascularization may be a promising strategy for advancing melanoma treatment.
Cerium oxide nanoparticles (nanoceria) hold promise for melanoma treatment due to their inherent redox properties. These properties allow them to mimic superoxide dismutase and catalase including the modulation of superoxide and hydroxyl radicals and oxidizing hydrogen peroxide. This intracellular redox property regulates oxidative stress and angiogenesis inducing toxicity in tumors while sparing healthy tissue.[ 14 , 15 , 16 , 17 ] Additionally, the biological activity of nanoceria can be modified by adjusting the nanoparticle corona. For example, heparin functionalization of nanoceria enhances angiogenesis by potentiating angiogenic growth factors.[ 18 , 19 ] Therefore, nanoceria offer an opportunity to improve therapeutic nanoparticle penetration into solid tumors via the bloodstream.
Representative preclinical models of melanoma are essential for advancing our understanding of melanoma biology and predicting the mechanisms of action of new therapies, including nanoparticle penetration into solid tumors. Such models are anticipated to streamline the pathway to clinical application, as current models have limited predictive performance in humans.[ 12 ] While 2D cultures of isolated melanoma cells are commonly used in early‐phase research, they fail to replicate the complex tumor microenvironment, which includes blood vessels, extracellular matrix, and host cells, and do not allow for the assessment of nanoparticle penetration into solid tumors.[ 20 ] Spheroid and organoid cultures have gained popularity as 3D in vitro models. Although organoid cultures retain the tissue architecture of patient‐derived tumor tissue and enable nanoparticle penetration assessment, challenges of culture stability, reproducibility, and vascularization persist for both spheroid and organoid cultures.[ 21 , 22 ]
Animals models of melanoma, including genetically engineered models and immunodeficient rodents supporting patient‐derived xenografts, help address the limitations of blood supply in in vitro systems. However, rodent models face challenges such as low tumor engraftment rates, lengthy experimental protocols, and high costs.[ 23 ] The chorioallantoic membrane (CAM) of fertilized chicken eggs is emerging as a valuable in vivo model. It is highly vascularized, supports xenograft engraftment due to the incomplete immune system development at early embryonic stages, and allows short experimental timeframes in a low‐cost, high‐throughput system.[ 24 , 25 , 26 ] These features are crucial in the early preclinical development of new melanoma treatments, especially for nanomedicine screening approaches.
Here, we optimize the method for melanoma cell administration to maximize engraftment in the CAM and utilize this model to investigate the correlation between tumor vascularization and nanoceria penetration. We observe that basement membrane molecules enhance melanoma cell adhesion and support the engraftment of melanoma cell spheroids in the CAM. Additionally, we observe that the chicken vasculature grows throughout the melanoma spheroids engrafted in the CAM. This model demonstrates that heparin‐functionalized nanoceria exhibit enhanced penetration into melanoma spheroids compared to nanoceria, along with increased spheroid vascularization. Overall, this study highlights the utility of the CAM as a model for assessing the interplay between nanoparticle properties, nanoparticle penetration within tumor spheroids, and the regulation of tumor vascularization toward high‐throughput nanomedicine screening approaches.
2. Results
2.1. Melanoma Cell Spheroids in the CAM are Perfused with Chicken Vasculature Expressing a Basement Membrane
We first established an in vivo model of melanoma to enable us to study the interplay between nanoparticle properties and interactions with melanoma spheroids. Various routes of tumor cell administration to the CAM have been reported,[ 27 ] so we first optimized the method of melanoma cell administration for maximal engraftment and embryo viability (Figure 1A). Of the methods tested, the addition of melanoma cells embedded in Matrigel (spheroid), which is rich in basement membrane components,[ 28 ] and implanted on the CAM at embryonic day (E)8 yields a 6‐fold higher level of melanoma cell engraftment than when either a cell suspension or spheroids are implanted on the CAM at E7 alone or together with either trypsin or injury treatment (Figure 1B). Similar results were obtained with both human ovarian adenocarcinoma and colon carcinoma cells (Figure S1, Supporting Information). Thus, melanoma cell spheroids were applied to the CAM on E8 in subsequent experiments.
Figure 1.

Optimization of melanoma cell engraftment in the CAM measured by the proportion of fertilized eggs with successful engraftment at E11. A) Schematic of the different conditions tested to optimize melanoma cell engraftment in the CAM. Melanoma cells were either added to the CAM in a cell suspension, embedded in Matrigel prior to addition to the CAM (spheroid), the CAM was treated with trypsin (0.06%) prior to the addition of the spheroid (Spheroid + trypsin) or punctured with a 23 gauge (23G) needle (Spheroid + injury) immediately prior to spheroid administration. Cells were applied to the CAM on fertilized egg E7 (n = 7) or E8 (n = 64). Created with https://BioRender.com B) Analysis of CAM viability and melanoma cell engraftment in the CAM at E11.
The human melanoma cell spheroids were further analyzed after explantation from the CAM at either E11, representing the time of nanoparticle administration, or E14, the end timepoint to establish the effect of nanoparticle treatment. Brightfield microscope micrographs indicate that chicken blood vessels associate with the surface of melanoma cell spheroids at E11 (Figure 2A). Additionally, histological analyses indicate association of the melanoma cell spheroids with the CAM tissue at E11 and E14 (Figure 2B). Notably, the central region of the melanoma cell spheroids at E14 contain viable melanoma cells while regions rich in Matrigel are also evident (Figure 2B). Perfused blood vessels are present throughout the spheroid at E14 as shown by light sheet microscope micrographs (Figure 2C,D). Furthermore, immunohistochemical analyses indicate the expression of basement membrane components, laminin and perlecan, at both E11 and E14 which is associated with the chicken vasculature both in the melanoma cell spheroids and the CAM (Figure 2E–I). Furthermore, weaker expression of laminin is detected in regions rich in Matrigel compared to the CAM tissue (Figure 2F,H). Together these data indicate that the melanoma cell spheroids remain viable in the CAM up to E14 and are perfused with chicken blood vessels. Therefore, the implantation of melanoma cells embedded in Matrigel (spheroid) on the CAM at E8 is a suitable model to explore nanoparticle interactions with melanoma spheroids in vivo.
Figure 2.

Chicken vasculature expressing basement membrane penetrates the melanoma cell spheroid. A) Representative brightfield microscope micrograph of melanoma cell spheroids in the CAM on E11. Scale bar is 1 mm. B) Representative gross morphological appearance of the melanoma cell spheroids in the CAM at E14 stained with hemotoxylin and eosin (H&E). Scale bar is 200 µm. The boxed areas are shown at higher magnification in inset panels (i) – (iii). The dashed blue line indicates the melanoma cell spheroid margins. Scale bar is 50 µm. M indicates Matrigel. C) Representative light sheet microscope micrograph of blood vessels (white; Alexa Fluor 647‐wheatgerm agglutinin (WGA)) in a melanoma cell spheroid explanted from the CAM on E14. The dashed blue line indicates the spheroid margins, and the dashed yellow box is shown in a different projection in D). Scale bar is 1 mm in panels (C)–(D). E) Representative image of a melanoma cell spheroid in the CAM at E11 immunostained for laminin. The dashed blue line indicates the spheroid margins. Scale bar is 200 µm. F) High magnification of the boxed region in (E). G) Representative image of a similar region as shown in (E) immunostained for laminin on E14. H) Representative image of a similar region as shown in (E) immunostained for perlecan on E11. I) Representative image of a similar region as shown in (E) immunostained for perlecan on E14. Scale bar is 50 µm for panels (F)–(I).
The formation of blood vessels throughout the melanoma cell spheroid engrafted in the CAM indicates that the vascular microenvironment plays a role in melanoma spheroid viability and performance.[ 29 ] Thus, it was of interest to explore whether melanoma cells adhere to the endothelial extracellular matrix (ECM). A four‐fold higher level of melanoma cells adhere to the endothelial cell ECM than tissue culture plastic (TCP) (p < 0.0001) (Figure 3A,B). Furthermore, melanoma cells are 1.8‐fold larger in area when adhered in endothelial cell ECM compared to when adhered on TCP (p < 0.0001) (Figure 3C). These data suggest that the endothelial ECM provides a superior environment for melanoma cell adhesion compared to TCP.
Figure 3.

Melanoma cells adhere to the endothelial cell ECM. A) Representative confocal microscope micrographs of melanoma cell morphology at 4 h post‐seeding on either TCP) or endothelial cell ECM showing polymerized actin fibers (Rhodamine‐phalloidin, red) and nuclei (DAPI, blue). Scale bar is 100 µm. B) Melanoma cell adhesion to ECM relative to TCP quantified from ≈10 images per experiment (n = 3). Data presented in a violin plot with the median indicated by the black line. C) Melanoma cell area when adhered on either TCP or ECM quantified from ≈10 images per experiment (n = 3). Data presented in a violin plot with the median indicated by the black line. **** p ≤ 0.0001 analyzed by an unpaired student's t‐test.
Having established that melanoma cells adhere to the endothelial ECM, we next determined the identity of molecules comprising the ECM of endothelial and melanoma cells. Peptide identification of the ECM identified basement membrane molecules including collagen type IV, laminin, and perlecan, as well as other ECM components, such as fibronectin in the ECM of endothelial cells (Table 1 ). In contrast, basement membrane molecules are not detected in the ECM of melanoma cells. However, melanoma cells secrete ECM molecules such as tenascin (Table 1).
Table 1.
Endothelial and melanoma cells differentially secrete ECM components. ECM from each cell type was analyzed by peptide liquid chromatography‐tandem mass spectrometry (LC‐MS2) and identified proteins are presented in alphabetical order. Confidence of peptide identity was assessed by the molecular weight search (MOWSE) score greater than 70. The number of unique peptide matches and sequence coverage (%) are indicated in the parentheses. ND, not detected.
| Protein | Accession number | MOWSE score (peptides identified, % sequence coverage) | ||
|---|---|---|---|---|
| Endothelial cells | Melanoma cells | |||
| Basement membrane | Collagen type IV (α1 chain) | P02462 | 82 (2,2) | ND |
| Collagen type IV (α2 chain) | P08572 | 146 (4,3) | ND | |
| Laminin (α5 chain) | O15230 | 194 (4,1) | ND | |
| Laminin (β1 chain) | P07942 | 112 (1,1) | ND | |
| Laminin (γ1 chain) | P11047 | 116 (2,2) | ND | |
| Perlecan | P98160 | 835 (26, 8) | ND | |
| Other ECM | α‐2‐HS glycoprotein | P02765 | ND | 199 (7, 26) |
| α‐2‐macroglobulin | P01023 | ND | 183 (7, 5) | |
| Fibronectin | P02751 | 556 (18,10) | ND | |
| Multimerin‐1 | Q13201 | 824 (26,23) | ND | |
| Plasminogen activator inhibitor 1 | P05121 | 661 (27, 39) | ND | |
| Protein CYR61 | O00622 | 655 (31, 48) | ND | |
| Tenascin | P24821 | ND | 225 (8, 26) | |
| Thrombospondin‐1 | P07996 | 1105 (41, 34) | 173 (4, 26) | |
Immunocytochemical analyses confirm that endothelial cells express basement membrane molecules including perlecan, collagen type IV, and laminin which localize extracellularly (Figure 4A) while melanoma cells exhibit low, intracellular expression of these molecules (Figure 4B). Together these data indicate distinct ECM molecule secretion by endothelial and melanoma cells.
Figure 4.

Melanoma cells adhere to basement membrane components expressed by endothelial cells. Representative confocal microscopy micrographs of A) endothelial and B) melanoma cells immunostained for the expression of perlecan (clone A74), collagen type IV, laminin, and fibronectin (green). Cells were counterstained for the cell membrane (blue). Scale bar is 40 µm in panels (A)‐(B). C) Melanoma cell adhesion to isolated basement membrane components including collagen type IV, laminin, and perlecan. Data presented as mean ± SD (n = 3) relative to the level of cell adhesion on fibronectin. ** p ≤ 0.01 and *** p ≤ 0.001 analyzed by one‐way ANOVA.
To explore which components of the endothelial cell ECM are involved in melanoma cell adhesion, the level of melanoma cell adhesion when plated on purified basement membrane components was compared to that on fibronectin, an established cell‐adhesive protein[ 30 ] (Figure 4C). Collagen type IV and laminin support 2.4‐ (p = 0.0099) and 3.8‐fold (p = 0.0001) higher, respectively, levels of melanoma cell adhesion than fibronectin while perlecan supports the same level of cell adhesion as fibronectin (p = 0.8918) (Figure 4C). These data indicate that multiple endothelial basement membrane molecules support the adhesion of melanoma cells. This may suggest that melanoma cells interact with multiple ECM components both in the spheroids containing Matrigel and due to the extensive chicken vasculature, which extends throughout the spheroids. Furthermore, the expression of laminin and perlecan within the melanoma spheroids engrafted in the CAM is most likely derived from the chicken vasculature.
2.2. Nanoceria Associate with Melanoma Cells In Vitro
We next explored the interaction of the previously characterized nanoceria and heparin functionalized nanoceria[ 18 ] with melanoma cells in vitro. These nanoparticles are cytocompatible at doses up to 400 µg mL−1 over 72 h of exposure (Figure 5A; Figure S2, Supporting Information). Confocal microscope micrographs indicate that both nanoceria and heparin functionalized nanoceria are internalized by melanoma cells (Figure 5B). Furthermore, the nanoparticles associate with melanoma cells over 24 and 72 h (Figure 5C,D; Figure S3, Supporting Information) as measured by flow cytometry with cells exposed to nanoceria exhibiting a 1.4‐fold (p < 0.0001) increased side scatter compared to the control. Additionally, the heparin functionalized nanoceria exhibit a 1.3‐fold (p < 0.0001) increased side scatter compared to cells exposed to nanoceria indicating that the heparin functionalization increases the association of nanoparticles with cells. Together these data suggest that nanoceria and heparin‐functionalized nanoceria associate with, and are internalized by, melanoma cells.
Figure 5.

Nanoceria are not cytotoxic to melanoma cells and are internalized. Melanoma cell number following exposure to nanoparticles (1–800 µg mL−1) relative to cells exposed to medium (Control) measured after 72 h by the MTS assay. 30% cell growth inhibition level is indicated by the dashed line. Data presented as mean ± SD (n = 3). B) Representative confocal microscope micrographs of the localization of nanoparticles (50 µg mL−1; conjugated with Alexa Fluor 488; green) with melanoma cells stained for polymerized actin fibers (rhodamine Phalloidin, red) and nuclei (Hoechst 33 342; blue) after 24 h. Scale bar is 20 µm. Nanoparticle association (50 µg mL−1) with cells measured by flow cytometry and presented as mean side scatter relative to cells exposed to medium (Control) after C) 24 or D) 72 h of exposure. Data presented as mean ± SD (n = 3). ****p ≤ 0.0001 analyzed by one‐way ANOVA. E) Intracellular rROS level following exposure of melanoma cells measured to nanoparticle (50 µg mL−1) for 24 h and then analyzed flow cytometry. Data presented as fold change in mean fluorescence intensity relative to cells exposed to medium (Control). Data are presented as mean ± SD (n = 3). *p ≤ 0.05 analyzed by one‐way ANOVA.
Given the intracellular localization of the nanoceria and heparin functionalized nanoceria, the ability of the nanoparticles to modulate reactive oxygen species (ROS) in melanoma cells was also determined. The heparin functionalized nanoparticles, irrespective of type, reduce ROS in the melanoma cells by 1.3‐fold (p < 0.05) relative to the Control over 24 h, while nanoceria do not reduce intracellular ROS (Figure 5E). These data suggest that the heparin functionalized nanoceria reduce the level of ROS and likely correlate with the increased intracellular accumulation.
2.3. Heparin Functionalized Nanoceria Promote Angiogenesis and Penetrate the Melanoma Spheroids In Vivo
Given the difference in ROS scavenging of nanoceria and heparin functionalized nanoceria, we next explored how the nanoparticles interact with melanoma cells when formed into spheroids and implanted in the CAM, a more physiologically relevant 3D model. With no difference in the level of association or ROS scavenging among the heparin functionalized nanoceria, L‐hep‐nanoceria‐B (highest level of heparin functionalization) was selected for further experiments and compared with nanoceria. Nanoparticles were added to the CAM model on E11 (Figure 6A). The addition of either nanoceria or L‐hep‐nanoceria‐B over the dose range of 200–1000 µg mL−1 does not alter either the spheroid size (Figure 6B–D) (≈2 mm in diameter) or the blood vessel density surrounding the spheroids at E14 (Figure 6E). In some CAMs, blood spots form, such as shown for spheroids treated with L‐hep‐nanoceria‐B (200 µg mL−1), indicative of leaky vasculature. Notably, the nanoparticles alter the CAM blood vessel density in areas more distant from the spheroids (Figure 6F). Specifically, the addition of nanoceria (400 µg mL−1) result in a 1.9‐fold increase in blood vessel density compared to Control (p = 0.006) while L‐hep‐nanoceria‐B (750 and 1000 µg mL−1) promote a 2.2‐ and 1.8‐fold, respectively, increase in blood vessel density compared to Control (p = 0.0002 and p = 0.0281, respectively). These data suggest that the nanoparticles are not toxic to either the melanoma cell spheroid or the CAM tissue and in areas distant from the melanoma spheroid behave as observed in the absence of spheroids.[ 18 ]
Figure 6.

Nanoparticles do not alter the melanoma cell spheroid size or CAM blood vessel density surrounding the spheroids. A) Schematic of the timeline for melanoma cell spheroid addition to the CAM on E8, nanoparticle administration on E11 and spheroid explantation and analysis on E14. Created with https://BioRender.com B) Representative dissecting microscope micrographs of the melanoma cell spheroids in the CAM at E14 exposed to either nanoceria or L‐hep‐nanoceria‐B at doses of 200–1000 µg mL. The black arrow indicates a blood spot. Scale bar is 1 mm. C) Schematic of a melanoma spheroid implanted in the CAM analyzed for size (panel D, diameter) and the location of blood vessels analyzed for blood vessel density surrounding the melanoma spheroids at E14 (panel E) and the CAM blood vessel density (panel F). D) Melanoma cell spheroid diameter following exposure to nanoparticles between E11 and E14. Data are presented as mean ± SD (n = 6–9). p < 0.05 for all comparisons. E) Blood vessel density surrounding the melanoma cell spheroid at E14. Data presented as mean ± SD (n = 4–7). p > 0.05 for all comparisons. F) Blood vessel density in the CAM distant from the melanoma cell spheroid at E14. Data presented as mean ± SD (n = 3–7). The range in number of CAMs analyzed for each condition vary due to the engraftment rate as indicated in Figure 1. *p ≤ 0.05, ** p ≤ 0.01, and ***p ≤ 0.001 analyzed by one‐way ANOVA compared to Control unless indicated otherwise.
Having established the effect of nanoparticle treatment on different areas of the CAM, we next sought to understand their effect on the melanoma spheroids. Using immunohistochemistry, we probed the spheroids explanted on E14 for the expression of perlecan and laminin. L‐hep‐nanoceria‐B promote 2.8‐ and 2.2‐fold increases in perlecan expression compared to the Control (p < 0.0001) and nanoceria (p < 0.0001), respectively (Figure 7A). Similarly, L‐hep‐nanoceria‐B promote 2.0‐ and 1.5‐fold increases in laminin expression compared to the Control (p < 0.0081) and nanoceria (p < 0.0238), respectively (Figure 7B). Using laminin is a marker for vascular maturation in the chicken embryo,[ 31 ] and noting its distinct immunolocalization around blood vessels (Figure 2G and 7B), we quantified the number of blood vessels positive for laminin in sections of spheroids (Figure 7C). L‐hep‐nanoceria‐B promote a 1.7 and 2.9‐fold increase the number of blood vessels in the melanoma spheroids compared to Control (p = 0.0022) and nanoceria (p < 0.0001), respectively. In contrast, nanoceria does not alter blood vessel density compared to the Control (p > 0.05) (Figure 7C). Together, these data indicate that L‐hep‐nanoceria‐B promote angiogenesis within melanoma spheroids.
Figure 7.
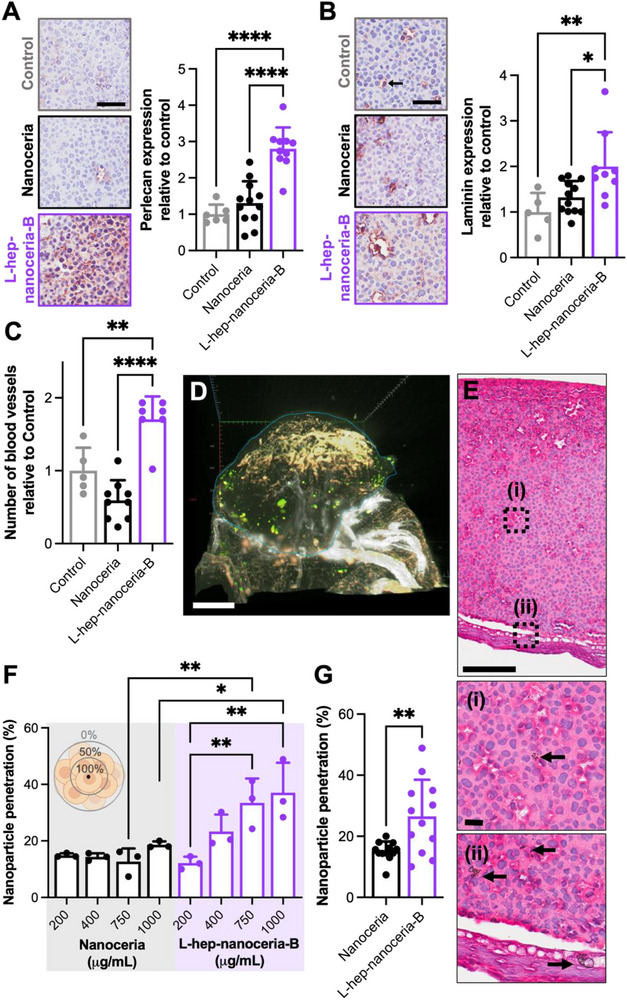
Heparin functionalized nanoceria promote vascularization and penetrate the melanoma spheroid to a greater extent than nanoceria. A) Representative images of melanoma cell spheroid cross sections (central region) immunostained for perlecan (brown) and counter stained with hemotoxylin (purple). Spheroids were treated with nanoparticles on E11 and explanted from the CAM and prepared for histological analysis at E14. Scale bar is 40 µm. Quantification of perlecan expression for each condition represented relative to Control. Data presented as mean ± SD (n = 6–12). ****p ≤ 0.0001 analyzed by one‐way ANOVA. B) Representative images of melanoma cell spheroid cross sections (central region) immunostained for laminin (brown) and counter stained with hemotoxylin (purple). Spheroids were treated with nanoparticles on E11 and explanted from the CAM and prepared for histological analysis at E14. Scale bar is 40 µm. Quantification of laminin expression for each condition represented relative to Control. Data presented as mean ± SD (n = 5–12). * p ≤ 0.05 and ** p ≤ 0.01 analyzed by one‐way ANOVA. C) Quantification of the number of blood vessels for each condition represented relative to Control. Data presented as mean ± SD (n = 5–9). The range in number of CAMs analyzed for each condition vary due to the engraftment rate as indicated in Figure 1. * p ≤ 0.05 and ** p ≤ 0.01 analyzed by one‐way ANOVA. D) Representative light sheet microscope image of melanoma cells (orange) in a spheroid explanted from the CAM at E14 following treatment with Alexa Fluor 488 conjugated nanoceria (400 µg mL−1; green). The blood vessels are stained with Alexa Fluor 647‐WGA (white). The dashed blue line indicates the spheroid margins. Scale bar is 300 µm. E) Representative gross morphological appearance of the melanoma cell spheroids treated with nanoceria (400 µg mL−1) at E11 and explanted from the CAM at E14 and stained with H&E. Scale bar is 100 µm. The dashed blue line indicates the melanoma cell spheroid. The boxed areas are shown at higher magnification in inset panels (i) – (ii). Inset scale bar is 20 µm. Arrows indicate the position of nanoceria. F) Quantification of the penetration of different doses of nanoceria and L‐hep‐nanoceria‐B into the melanoma cell spheroid at E14 presented as the percentage of total spheroid thickness. Data presented as mean ± SD (n = 3). *p < 0.05 and *p ≤ 0.01 analyzed by one‐way ANOVA. G) Quantification of the penetration of nanoceria and L‐hep‐nanoceria‐B (200–1000 µg mL−1) presented as a percentage of total spheroid. Data presented as mean ± SD (n = 12).
We next sought to investigate the penetration of the nanoparticles into the melanoma spheroids. Imaging of fluorescently labelled nanoceria (Figure S4, Supporting Information) and melanoma cells (Figure S5, Supporting Information) by light sheet microscopy indicates that nanoceria and blood vessels localize within spheroids (Figure 7D). Additionally, histological analyses indicate localization of the nanoparticles within melanoma spheroids (Figure 7E) at both the central region (Figure 7E‐i) and the periphery (Figure 7E‐ii) at E14. Quantification of the penetration depth of nanoparticles within the melanoma spheroids revealed no difference among the nanoceria doses (200–1000 µg mL−1) (p > 0.05) while L‐hep‐nanoceria‐B dose dependently increases penetration into the melanoma spheroids with a 2.8‐ and 3.0‐fold increase in penetration at doses of 750 and 1000 µg mL−1, respectively, compared to 200 µg mL−1 (p = 0.0051 and p = 0.0011, respectively) (Figure 7F). Furthermore, there is a 1.8‐fold higher depth of penetration of L‐hep‐nanoceria‐B into the spheroids compared to nanoceria (p = 0.0043) (Figure 7G) which is attributed to the increased penetration of L‐hep‐nanoceria‐B compared to nanoceria at concentrations of 750 (p = 0.0062) and 1000 (p = 0.017) µg mL−1 (Figure 7F). Collectively, these data indicate that heparin functionalized nanoceria promote angiogenesis and penetrate the melanoma spheroids to a greater extent than nanoceria.
3. Discussion
Preclinical models of melanoma are crucial for enhancing our understanding of melanoma biology and predicting the mechanisms of action of new therapies. Although in vitro models are frequently used in preclinical research, they fail to replicate the complex tumor microenvironment, especially the blood supply.[ 20 , 21 , 22 ] Immunocompromised rodents, which allow for the transplantation of human tumor cells, are often regarded as the gold standard for preclinical studies.[ 32 , 33 ] However, these rodent models are expensive, time‐consuming, and have a low tumor cell engraftment rate of ≈30%.[ 33 ] The CAM of fertilized chicken eggs is emerging as a valuable in vivo model. It is highly vascularized, supports xenograft engraftment due to the incomplete immune system development at early embryonic stages, and offers short experimental timeframes at a low cost.[ 24 , 26 , 33 ] Despite its potential, this model has not yet been widely used for the preclinical screening of nanoparticles.[ 25 , 34 , 35 , 36 ]
We compared tumor cell engraftment rates using five commonly reported methods, adding cells on either E7 or E8 to observe the effects of nanoparticles before immune system maturation by E15.[ 37 ] We tested the administration of a cell suspension, or cells mixed with Matrigel to either the intact CAM or following injury using a needle puncture or trypsin.[ 32 , 38 , 39 , 40 , 41 , 42 , 43 ] Our findings reveal that administering melanoma cells to the CAM at E8, when embedded in Matrigel, resulted in a higher engraftment rate (87.5%) and a lower chicken embryo death rate (5%) than previously reported rates (cell engraftment rates of 40–70% and chicken embryo death rates of 30–60%).[ 44 , 45 , 46 , 47 ] Similarly, administering either human ovarian adenocarcinoma (SKOV3) or human colon carcinoma (WiDr) cells with this protocol results in engraftment rates of 67–75% and chicken embryo death rates of 25–33%. Matrigel likely confined the cells within the CAM and provided a supportive microenvironment.[ 32 ] While needle puncture or trypsin is reported to facilitate direct tumor cell entry and engraftment in the CAM,[ 45 ] these methods caused the highest rates of chicken embryo death in our hands. Therefore, administering cells to the CAM at E8 when embedded in Matrigel appears to be a promising method for preclinical screening of cancer treatments.
Melanoma spheroids that successfully engrafted in the CAM developed an extensive vascular network, consistent with human melanoma.[ 32 , 48 ] Spheroids that did not engraft did not survive to E14. Blood vessels within the spheroids were perfused with WGA prior to sacrifice, which binds to the glycocalyx on endothelial cells,[ 49 ] showing similar localization to CD31‐immunostained blood vessels.[ 50 ] Blood spots observed around some spheroids indicate leaky blood vessels,[ 26 ] a key feature of the tumor vasculature in melanomas.[ 51 ] The engrafted spheroids maintained a rounded morphology and consistent size (2 mm in diameter) at both E11 and E14, facilitating easier measurement of size changes with treatment.[ 32 , 52 ]
The ECM is crucial in tumor development and angiogenesis.[ 53 ] We explored the localization of laminin and perlecan, key basement membrane molecules and markers of mature vasculature[ 31 , 54 ] using immunohistochemical staining and imaging affording higher resolution imaging than light sheet microscopy.[ 55 ] Although antibodies against laminin and perlecan are expected to react with human, chicken or mouse molecules,[ 56 , 57 ] immunostaining was primarily localized to blood vessels derived from the CAM, with weaker staining in the spheroid regions rich in Matrigel. This suggests that melanoma spheroids in the CAM model enable the study of interactions between the human melanoma cells and chicken vasculature including the origin of the tumor microenvironment. This model, thus, allows the assessment of nanoparticle penetration and their effects on angiogenesis, a key processes in melanoma progression, as demonstrated here, as well as tumor growth and metastasis, as previously reported.[ 58 ] Although, further research is warranted to fully assess the translational potential of this model, such as the exploration of vasculogenic mimicry.[ 59 ]
While no single preclinical model of melanoma fully captures all the features of the human condition, the CAM model offers significant benefits, especially for early‐phase in vivo preclinical screening of nanomedicines. The CAM can be engrafted with either established tumor cell lines, as presented here, or patient‐derived tumor cells for a personalized medicine approach that considers the heterogeneity of an individual's tumor.[ 58 ] The low‐cost and high‐throughput nature of this model, although exhibiting different temporal dynamics to human melanoma, allows for screening within clinically relevant timeframes, and with large therapeutic libraries not feasible with rodent models.[ 24 , 25 , 26 , 60 ]
Although the CAM model has its advantages, it cannot simulate the immune system's response to nanoparticles which may limit its utility in assessing the toxicity, biodistribution and efficacy. This limitation is significant for melanoma research, especially given the recent clinical success of immune checkpoint inhibitors.[ 61 ] However, the CAM model mirrors the angiogenic response reported during human melanoma progression. It is responsive to growth factors like vascular endothelial and fibroblast growth factors,[ 62 ] which are secreted by melanoma cells.[ 63 ] This leads to increased vessel permeability, as noted in this study and previously reported.[ 59 , 64 ] Therefore, while the CAM model is a valuable addition to the preclinical melanoma model toolkit, it does not replace existing models.
Nanoceria are promising nanoparticles due to their ability to react with intracellular ROS, affecting angiogenesis or oxidative stress depending on the context.[ 14 ] In vitro, nanoceria are dose‐dependently toxic to endothelial and melanoma cells via induction of oxidative stress.[ 15 , 65 ] However, in the CAM, nanoceria are cytocompatible at doses up to 1 mg mL−1[ 16 , 18 , 66 ] suggesting disparity of biological effects between preclinical in vitro and in vivo models similar to previous findings.[ 18 , 67 ] We first characterized the response of nanoceria to melanoma cells in vitro, finding that nanoceria and heparin‐functionalized nanoceria dose‐dependently reduce the number of viable melanoma cells over 72 h of exposure, with cytotoxicity only observed at the highest dose (1 mg mL−1). These findings are corroborated by an earlier report demonstrating the cytocompatibility of nanoceria with melanoma cells, which also showed a reduction in angiogenic gene expression in these cells.[ 16 ] Here, heparin functionalized nanoceria reduce intracellular ROS levels in melanoma cells without altering cell proliferation, possibly due to potentiation of fibroblast growth factor 2 (FGF2) signaling.[ 15 , 18 , 68 , 69 ] Indeed, we previously reported that heparin‐nanoceria bind and signal FGF2 both in vitro and in vivo in the CAM.[ 18 ] These studies highlight the mechanisms through which heparin‐nanoceria modulate both melanoma and endothelial cells. Further research will benefit from confirming these pathways using in vitro co‐culture models[ 70 , 71 ] or in vivo approaches using antibodies that neutralize growth factors.[ 72 , 73 ]
Administering nanoceria or heparin functionalized nanoceria to melanoma spheroids in the CAM over 72 h did not alter spheroid size, and no necrosis was observed, suggesting cytocompatibility.[ 18 ] These results contrast with previous findings in rodent models, likely due to different experimental timeframes and immune system involvement.[ 17 ] Furthermore, the nanoparticles increased blood vessel density in regions distant from the spheroid, indicating that they exert biological effects away from the spheroids in the same way as when the melanoma spheroids are not present as we previously reported.[ 18 ]
Immunohistochemical analyses showed increased blood vessel density within spheroids treated with L‐hep‐nanoceria‐B compared to nanoceria and control, consistent with the role of heparin in promoting angiogenesis.[ 62 , 74 ] However, surface blood vessel density around the spheroids was not altered with nanoparticle treatment. Nanoparticles were often localized to spheroid margins, possibly due to nanoparticle aggregation,[ 75 ] limiting paracellular transport.[ 76 ] Increased blood vessel density within spheroids treated with L‐hep‐nanoceria‐B correlated with improved nanoparticle penetration, likely due heparin's affinity for endothelial cells and ECM molecules like laminin[ 77 ] facilitating improved delivery via the bloodstream[ 78 ] as reported for other heparin functionalized nanoparticles.[ 79 ] Furthermore, the physicochemical properties of heparin functionalized nanoceria play a role, with L‐hep‐nanoceria‐B having a zeta potential of ‐22 mV compared to 40 mV for nanoceria.[ 18 ] Nanoparticles with a negative surface charge more readily diffuse into tumor spheroids[ 80 , 81 ] and exhibit improved circulation times.[ 82 ] New studies exploring the interactions of heparin‐nanoceria in preclinical models further will enhance our understanding of how the vasculature facilitates the delivery of therapeutics to melanoma through nanomedicine approaches.
4. Conclusion
We presented an optimized method for tumor cell engraftment in the CAM and applied this model to study nanoceria interactions with melanoma spheroids. Our findings show that heparin functionalized nanoceria enhance angiogenesis and nanoparticle penetration into melanoma spheroids engrafted in the CAM. These results suggest potential applications for heparin functionalized nanoceria in melanoma treatment, such as when loaded with therapeutic cargo. Additionally, the optimized CAM engraftment method offers a scalable, low‐cost platform for preclinical nanoparticle screening and therapy responsiveness testing in precision medicine, requiring only a small number of patient‐derived cells.
5. Experimental Section
All reagents were purchased from Sigma‐Aldrich unless stated otherwise.
Culture of Melanoma Cells
The human melanoma cell line, MM200, was cultured in Dulbecco's modified essential medium (DMEM) containing 10% (v/v) fetal bovine serum (FBS) and penicillin (100 U mL−1) and streptomycin (100 µg mL−1) at 37 °C with 5% CO2 with the medium changed every 3–4 days.
Culture of Endothelial Cells
Primary human umbilical vein endothelial cells (Lonza) were maintained in endothelial cell growth medium (EGM‐2 BulletKit, Lonza) at 37 °C with 5% CO2 and used at passages 2 – 8. The medium was replaced every 3 to 4 days.
Culture of Human Ovarian Adenocarcinoma Cells
The human ovarian adenocarcinoma cell line (ATCC), SKOV3, was cultured in RPMI‐1640 medium containing 10% (v/v) FBS and penicillin (100 U mL−1) and streptomycin (100 µg mL−1) at 37 °C with 5% CO2 with the medium changed every 3–4 days.
Culture of Human Colon Carcinoma Cells
The human colon carcinoma cell line (ATCC), WiDr, was cultured in DMEM medium containing 10% (v/v) FBS, penicillin (100 U mL−1) and streptomycin (100 µg mL−1) at 37 °C with 5% CO2 with the medium changed every 3–4 days.
Optimization of the Cell Engraftment in the CAM of Fertilized Chicken Eggs
CAM protocols were approved by the UNSW Animal Care and Ethics Committee (ACEC 19/22B and 19/18B) using fertilized chicken eggs (Barter & Sons Hatchery, Sydney, Australia) received at (E) 0. Eggs were cleaned with 80% (w/v) ethanol and placed in an egg incubator (Multiquip) at 37.6 °C with 45–50% humidity for 3 days with rotation every 5 h. On E4, a window was cut in the eggshell (≈1.2 cm2) and covered with transparent tape (Aquafilm) following removal of albumin (3 mL) with a needle (G19) to detach the CAM from the shell. On E7, a silicone ring was placed on the CAM and cells were placed on the CAM as a cell suspension (2 × 10⁷ cells in 50 µL medium) to the intact CAM. Alternatively, cells (2 × 10⁷ cells) were mixed with growth factor reduced and phenol red‐free Matrigel (50 µL; Corning) to form a spheroid prior to being placed on the CAM at either E7 or E8 or at E7 immediately following either a needle (G23) puncture injury or administration of trypsin (0.06% trypsin in 0.01% EDTA; 2 µL). At E11, the spheroid and surrounding CAM tissue was excised following euthanasia and imaged using a dissecting microscope (M80, Leica). Images were visually inspected for melanoma cell engraftment.
Assessment of Cell Spheroids by Histology or Immunohistochemistry
Following dissecting microscope imaging as described above, spheroids were fixed in paraformaldehyde (4% w/v) for 72 h at 4 °C. Spheroids were cut in half and embedded such that the center of the spheroid was sectioned (5 µm) and analyzed. Sections were deparaffinized using xylene (twice, 5 min each) and the graded ethanol washes (twice in 100% (v/v), once in 95% (v/v), once in 70% (v/v), 3 min each) followed by a deionized water rinse for 3 min.
Selected sections were stained with hematoxylin (Vector Laboratories) for 5 min and then rinsed in deionized water until the water was colorless. The sections were then incubated in acid alcohol for 10 s followed by 10 s in tap water. The sections were incubated in bluing solution for 2 min followed by rinsing with deionized water and then stained with eosin (Fronine) for 2 min. The slides were dehydrated by graded ethanol washes (once in 90% (v/v), twice in 100% (v/v), 1 min each) followed by two washes with xylene for 5 min each followed by mounting and imaging using a slide scanner (ScanScope XT scanner, Aperio).
Alternatively, sections were prepared for immunohistochemical analysis by treatment with protease type XXIV (1.5 mg mL−1) diluted in Tris‐HCl (50 mm), NaCl (150 mm), pH 7.6 (Tris‐buffered saline; TBS) for 15 min at 37 °C. Sections were then washed twice with TBS and blocked with bovine serum albumin (BSA) (1% w/v) in TBS containing Tween‐20 (0.05 w/v%) (TBS‐T) for 1 h at room temperature (RT). Selected slides were permeabilized with TBS containing Triton X‐100 (0.1% w/v) for 15 min at RT prior to the blocking step. Sections were then incubated with anti‐perlecan (CCN‐1; 1:1000; produced in‐house against immunopurified endothelial cell‐derived perlecan[ 54 , 83 ]) or anti‐laminin (1:400; Rockland) rabbit polyclonal antibodies diluted in BSA (1% w/v) in TBS‐T for 16 h at 4 °C. Sections were then rinsed twice with TBS‐T and incubated with streptavidin‐horseradish peroxidase (1:200; GE Healthcare) followed by four rinses with TBS‐T followed by the addition of NovaRED chromogen (Vector Laboratories). The sections were counterstained with hemotoxylin for 2 min, rinsed with deionized water and dehydrated by graded ethanol incubations as above. Finally, sections were incubated with xylene (5 min) and mounted prior to imaging using a slide scanner (ScanScope XT scanner, Aperio).
Characterization of the Engrafted Cell Spheroids by Light Sheet Microscopy
Melanoma cell spheroids and surrounding CAM tissue were excised following euthanasia and placed in sterile Dulbecco's phosphate buffered saline pH 7.4 (PBS). Alexa Fluor 647 conjugated WGA (20 µg mL−1 diluted in sterile phosphate buffered saline (PBS); Thermo Fisher Scientific) was injected into the largest CAM blood vessel until the tissue became colorless followed by flushing with PBS for 5 min and then fixation with 4% (w/v) paraformaldehyde for 72 h at 4 °C. Fixed tissue was then rinsed with several exchanges of PBS for 48 h at 37 °C with gentle shaking and then immersed in CUBIC reagent 1 (urea (25% w/v), N,N,N′,N′‐tetrakis (2‐hydroxypropyl) ethylenediamine (25% w/v), and Triton X‐100 (15% w/v)) for 5 days at 37 °C with gentle shaking with an exchange of the CUBIC reagent 1 after 1 day. The tissue was then washed with PBS for 24 h at 37 °C with gentle shaking before being embedded into low melting agarose. The embedded tissue was then immersed in CUBIC reagent 2 (sucrose 50% (w/v), urea 25% (w/v), 2,2,2′‐nitrilotriethanol 10% (w/v) and Triton X‐100 0.1% (v/v)) for 48 h at 37 °C with gentle shaking with an exchange of the CUBIC reagent 2 after 1 day. The tissue was imaged using a light sheet microscope (Lightsheet Z.1, Zeiss) using a 5× NA0.16 objective and dual‐side illumination and fluorescent WGA‐stained vessels were imaged using a 647 nm laser. Samples were imaged with z‐interval of 4.7 µm and 3D images were reconstructed using the arivis software.
ECM Synthesis
Cells were cultured as above on either 18‐well µ‐slides (ibidi GmbH) or tissue culture well plates for one week. Under sterile conditions, cells were washed twice with PBS and then incubated multiple times with EDTA (5 mm) in PBS, pH 7.3 at 37 °C for 5 min until all cells were removed as determined by phase contrast microscopy. Culture slides or plates were then incubated with EDTA (5 mm) in PBS, pH 7.3 at 4 °C for 16 h to inactivate remaining metalloproteases. The culture slides or plates were then washed twice with PBS, sealed with parafilm and stored at ‐30 °C until required.
Peptide Identification of ECM by Mass Spectrometry
ECM was prepared in 6‐well tissue culture plates as described above, washed with NH4HCO3 (25 mm) and then reduced (10 mm DTT, 10 min, 95 °C), alkylated (25 mm iodoacetamide, 20 min, RT), and digested (sequencing grade trypsin (Promega), 20 µg mL−1, 16 h, 37 °C). The supernatant was collected from each well and desalted with PBS using 10 kDa molecular weight cut‐off centrifugal filter (Amicon) according to manufacturer's instructions. Samples were subjected to peptide analysis by LC‐MS2 using an LTQ mass spectrometer (Thermo Fisher Scientific). The data was analyzed using the peaklist‐generating software Mascot Daemon/extract_msn (version 2.5.1; Matrix Sciences) and the Mascot search engine (version 2.6.2) together with the NCBI sequence database with the homo sapiens taxonomy (November 2016 with 97105869 total sequences/309980 human sequences in the database) with the following parameters: no fixed modifications; variable modifications = carbamidomethyl (C), oxidation (M) and propionamide (C); peptide mass tolerance = 4 ppm, fragment mass tolerance = 0.4 Da, maximum missed cleavages = 1; threshold score = MOWSE score >70.
Melanoma Cell Interactions with Endothelial ECM
Endothelial ECM coated 96‐well tissue culture plates were produced as described above. Alternatively, immunopurified endothelial cell perlecan prepared as previously described[ 54 ] (10 µg mL−1), collagen type IV (10 µg mL−1), laminin (2 µg mL−1), or fibronectin (1 µg mL−1), were coated onto tissue culture plates at RT for 2 h followed by blocking with denatured bovine serum albumin (BSA; 1% (w/v) in PBS at RT for 2 h. Wells were washed twice with PBS prior to the addition of melanoma cells (2 × 10⁴ cells per well) which had been harvested from cell culture flasks using EDTA (20 mm) in PBS.
After 4 h of cell exposure, wells were washed twice with PBS and fixed in paraformaldehyde (4% w/v) in PBS for 15 min at 37 °C and permeabilized using sucrose (300 mm), NaCl (50 mm), MgCl2 (3 mm), HEPES (2 mm), Triton X‐100 (0.5 w/v%), pH 7.2 in deionized water (permeabilizing solution) for 4 min at 4 °C. Cells were blocked with BSA (1% w/v) in PBS for 16 h at 4 °C and then washed twice with PBS containing Tween‐20 (PBS‐T; 0.1% w/v) before the addition of either Rhodamine‐phalloidin (1:200 in PBS‐T; Thermo Fisher Scientific) at RT for 1 h in the dark and DAPI (1:1000, Thermo Fisher Scientific) for 30 min at RT or primary antibodies at RT for 2 h. Primary antibodies included mouse monoclonal antibodies against perlecan (2 mg mL−1; clone A74; AbCam) or collagen type IV (2 mg mL−1; clone Col94) or a rabbit polyclonal anti‐laminin antibody (Rockland). Cells were then incubated with either goat anti‐mouse Alexa Fluor 488 (1:500; Invitrogen) or goat anti‐rabbit Alexa Fluor 488 (1:500; Invitrogen) at RT for 1 h in the dark and counterstained with CellMask Deep red membrane stain (1:1000; Invitrogen) at RT for 1 h. Samples were washed twice with PBS‐T and a final rinse with PBS at 4 °C prior to imaging using a confocal microscope (IX70, Olympus or SP8, Leica).
Alternatively, after 4 h of cell exposure, wells were washed twice with PBS, stored at ‐30 °C for a minimum of 24 h and then analyzed by the CyQuant assay (Invitrogen) as per the manufacturer's instructions.
Nanoceria Synthesis and Characterization
Nanoceria were synthesized via precipitation using high purity cerium (III) nitrate hexahydrate and sodium hydroxide and subsequently functionalized with 3‐aminopropyltriethoxysilane (APTES) followed by conjugation with either unfractionated heparin (Hep‐nanoceria) or different amounts of low molecular weight heparin (L‐hep‐nanoceria‐A and L‐hep‐nanoceria‐B) as previously described.[ 18 ] Hep‐nanoceria and L‐hep‐nanoceria‐B contained similar and a eight‐fold higher amount of heparin than L‐hep‐nanoceria‐A while Hep‐nanoceria and L‐hep‐nanoceria‐A contained a similar heparin grafting density which was four‐fold lower than that on L‐hep‐nanoceria‐B.[ 18 ] Selected nanoparticles were also functionalized with Alexa Fluor 488 as previously described.[ 18 ]
Cytotoxicity
Cells (104/well) were seeded into 96‐well cell culture plates and incubated for 4 h prior to the addition of nanoparticles (0 – 800 µg mL−1 diluted in medium). After incubation for 68 h, the MTS assay was performed as per the manufacturer's instructions (CellTiter 96AQueous One Solution, Promega) with absorbance (490 nm) measured using plate reader (Synergy HTX multi‐mode reader, BioTek). Triplicate wells were prepared for each condition and background measurements were taken for each condition in the absence of either cells or nanoparticles.
Intracellular ROS and nanoparticle association with cells
Intracellular ROS was measured using 2‐, 7‐dichlorodihydrofluorescein diacetate (DCFH‐DA), a membrane‐permeable dye that becomes fluorescent when oxidized by H2O2 and widely used to study the ROS scavenging capability of nanoceria.[ 17 , 84 ] Cells (5 × 10⁵/well) were seeded into 12‐well plates and incubated for 4 h at 37 °C prior to the addition of nanoparticles (50 µg mL−1) or equivalent amounts of heparin (2.05 µg mL−1 Hep, 0.55 µg mL−1 L‐hep‐A, or 2.7 µg mL−1 L‐hep‐B). Cells were harvested using trypsin and resuspended in EDTA (2 mm), BSA (0.5% w/v in PBS) (flow buffer) containing DCFH‐DA (1 µm) and incubated for 30 min before being washed and incubated in flow buffer containing propidium iodide (5 µg mL−1) for 10 min. Cells were then analyzed in a flow cytometer (LSRFortessa SORP, BD) for fluorescence intensity (DCF and PI), forward scatter (FSC) and side scatter (SSC) for 104 cells after gating to exclude cell debris and to include single, live cells stained with DCF.
Visualization of Nanoparticle Uptake by Cells
Cells were grown in 8‐well plastic slides (Ibidi) for 4 h before being exposed to Alexa Fluor 488 conjugated nanoparticles (50 µg mL−1 in culture medium) for 24 h. Cells were then washed twice with PBS and incubated with Hoechst 33 342 (1:2000 in PBS) for 5 min. Cells were then rinsed twice with PBS and fixed with 4% (w/v) paraformaldehyde in PBS for 15 min at 37 °C. The cells were then washed twice with PBS and permeabilized with permeabilizing solution for 5 min at 4 °C. Cells were then blocked with BSA (1% w/v) in PBS for 16 h at 4 °C. Cells were then washed twice with PBS containing Tween‐20 (PBST; 0.1% w/v) before the addition of Rhodamine‐phalloidin (1:200 in PBST; Thermo Fisher Scientific) for 1 h at room temperature in the dark. After three rinses with PBST, the cells were visualized with a confocal microscope (SP8, Leica; objective NA = 1.4).
Effect of Nanoparticles on the Melanoma Cell Spheroids in the CAM
Alexa Fluor 488‐nanoceria or L‐hep‐nanoceria‐B (200–1000 µg mL−1) were administered to CAMs with engrafted melanoma cell spheroids as described above under protocols approved by the UNSW Animal Care and Ethics Committee (ACEC 19/22B and 19/18B). On E14, eggs were euthanized prior to excision of the spheroids and surrounding CAM tissue. Tissue was imaged under a dissecting microscope as detailed above. Images were analyzed for spheroid diameter as well as blood vessel density adjacent to the spheroid and more distant from the spheroid using software developed in‐house.[ 18 ] Alternatively, excised tissue was prepared for histology and immunohistochemical analyses as described above. Images were analyzed for nanoparticle penetration into melanoma spheroids, basement membrane component expression, and blood vessel number and density using Fiji (ImageJ).
In selected experiments, melanoma cells expressing mCherry in the cytoplasm were prepared by transfection with a plasmid (CEFLP[ 85 ]) using Lipofectamine 3000 (Thermo Fisher Scientific) followed by 14‐day culture under antibiotic selection (G418, 400 µg mL−1) and cell sorting via flow cytometry (FACSAria III, BD). Melanoma cells expressing mCherry in the cytoplasm were used to form spheroids prior to implantation in the CAM as described above. On E14, following egg euthanasia, the spheroids and surrounding CAM tissue were excised and prepared for light sheet microscopy as described above.
Statistical Analyses
Statistically significant differences were determined by one‐way analysis of variance (ANOVA) and the Tukey post‐test or an unpaired student's t‐test after assessment of data normality using Prism version 10 (GraphPad). Data are expressed as mean ± standard deviation (SD) unless stated otherwise. Statistical significance was accepted at p ≤ 0.05 and indicated in the figures as *p ≤ 0.05, **p ≤ 0.01, ***p ≤ 0.001, and ****p ≤ 0.0001.
Conflict of Interest
The authors declare no conflict of interest.
Supporting information
Supporting Information
Acknowledgements
This work was funded in part by the Australian Research Council (LP140101056 (M.S.L. and J.M.W.) and FT220100092 (M.S.L.)). L.F. and J.Y. were supported by the Australian Government Research Training Program Scholarship. Microscopy were performed at the Katharina Gaus Light Microscopy Facility. Flow cytometry was performed at the Flow Cytometry Facility and mass spectrometry was performed at the Bioanalytical Mass Spectrometry Facility (BMSF). These facilities are in the Mark Wainwright Analytical Centre at UNSW and are in part funded by the Research Infrastructure Scheme at UNSW. The authors thank Ms Sydney Liu at BMSF for performing mass spectrometry analyses. The table of contents graphic was created with the assistance of https://BioRender.com
Open access publishing facilitated by University of New South Wales, as part of the Wiley ‐ University of New South Wales agreement via the Council of Australian University Librarians.
Fu L., Yong J. M., Yeh R., Bartlett F., Whitelock J. M., Lord M. S., Functionalized Cerium Oxide Nanoparticles Enhance Penetration into Melanoma Spheroids In Vivo through Angiogenesis. Adv. Healthcare Mater. 2025, 14, 2405129. 10.1002/adhm.202405129
Data Availability Statement
The data that support the findings of this study are available from the corresponding author upon reasonable request.
References
- 1. Bhatia S., Tykodi S. S., Thompson J. A., Oncology 2009, 23, 488. [PMC free article] [PubMed] [Google Scholar]
- 2. Gloster H. M. Jr., Brodland D. G., Dermatol. Surg. 1996, 22. [DOI] [PubMed] [Google Scholar]
- 3. Mar V., Soyer H., Button‐Sloan A., Fishburn P., Gyorki D., Hardy M., Henderson M., Thompson J., Aust. J. Gen. Practit. 2020, 49, 733. [DOI] [PubMed] [Google Scholar]
- 4. Furukawa K., Nagano T., Tachihara M., Yamamoto M., Nishimura Y., Molecules 2020, 25, 3900. [DOI] [PMC free article] [PubMed] [Google Scholar]
- 5. Soengas M. S., Lowe S. W., Oncogene 2003, 22, 3138. [DOI] [PubMed] [Google Scholar]
- 6. Atkins M. B., Curiel‐Lewandrowski C., Fisher D. E., Swetter S. M., Tsao H., Aguirre‐Ghiso J. A., Soengas M. S., Weeraratna A. T., Flaherty K. T., Herlyn M., Sosman J. A., Tawbi H. A., Pavlick A. C., Cassidy P. B., Chandra S., Chapman P. B., Daud A., Eroglu Z., Ferris L. K., Fox B. A., Gershenwald J. E., Gibney G. T., Grossman D., Hanks B. A., Hanniford D., Hernando E., Jeter J. M., Johnson D. B., Khleif S. N., Kirkwood J. M., et al., Clin. Cancer Res. 2021, 27, 2678. [DOI] [PMC free article] [PubMed] [Google Scholar]
- 7. Kong B. Y., Carlino M. S., Menzies A. M., Melanoma Manage. 2016, 3, 33. [DOI] [PMC free article] [PubMed] [Google Scholar]
- 8. Rashid S., Shaughnessy M., Tsao H., Dermatol. Clin. 2023, 41, 49. [DOI] [PubMed] [Google Scholar]
- 9. Seidel J. A., Otsuka A., Kabashima K., Front. Oncol. 2018, 8, 00086. [DOI] [PMC free article] [PubMed] [Google Scholar]
- 10. Cazzato G., Ingravallo G., Ribatti D., Cancers 2024, 16, 1794. [DOI] [PMC free article] [PubMed] [Google Scholar]
- 11. Gao J., Wang W.‐Q., Pei Q., Lord M. S., Yu H.‐J., Acta Pharmacol. Sin. 2020, 41, 986. [DOI] [PMC free article] [PubMed] [Google Scholar]
- 12. Shen X., Pan D., Gong Q., Gu Z., Luo K., Bioactive Mater. 2024, 32, 445. [DOI] [PMC free article] [PubMed] [Google Scholar]
- 13. Torosean S., Flynn B., Axelsson J., Gunn J., Samkoe K. S., Hasan T., Doyley M. M., Pogue B. W., Nanomedicine 2013, 9, 151. [DOI] [PMC free article] [PubMed] [Google Scholar]
- 14. Lord M. S., Berret J. F., Singh S., Vinu A., Karakoti A. S., Small 2021, 17, 2102342. [DOI] [PubMed] [Google Scholar]
- 15. Lord M. S., Tsoi B., Gunawan C., Teoh W. Y., Amal R., Whitelock J. M., Biomaterials 2013, 34, 8808. [DOI] [PubMed] [Google Scholar]
- 16. Yong J. M., Fu L., Tang F., Yu P., Kuchel R. P., Whitelock J. M., Lord M. S., ACS Biomater. Sci. Eng. 2022, 8, 512. [DOI] [PubMed] [Google Scholar]
- 17. Giri S., Karakoti A., Graham R. P., Maguire J. L., Reilly C. M., Seal S., Rattan R., Shridhar V., PLoS One 2013, 8, 54578. [DOI] [PMC free article] [PubMed] [Google Scholar]
- 18. Fu L., Li R., Whitelock J. M., Lord M. S., Regener. Biomater. 2022, 9, rbac081. [DOI] [PMC free article] [PubMed] [Google Scholar]
- 19. Nethi S. K., Nanda H. S., Steele T. W. J., Patra C. R., J. Mater. Chem. B 2017, 5, 9371. [DOI] [PubMed] [Google Scholar]
- 20. Kapałczyńska M., Kolenda T., Przybyła W., Zajączkowska M., Teresiak A., Filas V., Ibbs M., Bliźniak R., Łuczewski Ł., Lamperska K., Arch. Med. Sci. 2018, 14, 910. [DOI] [PMC free article] [PubMed] [Google Scholar]
- 21. Yuki K., Cheng N., Nakano M., Kuo C. J., Trends Immunol. 2020, 41, 652. [DOI] [PMC free article] [PubMed] [Google Scholar]
- 22. Veninga V., Voest E. E., Cancer Cell 2021, 39, 1190. [DOI] [PubMed] [Google Scholar]
- 23. Mak I. W., Evaniew N., Ghert M., Am. J. Transl. Res. 2014, 6, 114. [PMC free article] [PubMed] [Google Scholar]
- 24. DeBord L. C., Pathak R. R., Villaneuva M., Liu H. C., Harrington D. A., Yu W., Lewis M. T., Sikora A. G., Am. J. Cancer Res. 2018, 8, 1642. [PMC free article] [PubMed] [Google Scholar]
- 25. Vu B. T., Shahin S. A., Croissant J., Fatieiev Y., Matsumoto K., Le‐Hoang Doan T., Yik T., Simargi S., Conteras A., Ratliff L., Jimenez C. M., Raehm L., Khashab N., Durand J.‐O., Glackin C., Tamanoi F., Sci. Rep. 2018, 8, 8524. [DOI] [PMC free article] [PubMed] [Google Scholar]
- 26. Mangir N., Raza A., Haycock J. W., Chapple C., MacNeil S., In Vivo 2018, 32, 461. [DOI] [PMC free article] [PubMed] [Google Scholar]
- 27. Fischer D., Fluegen G., Garcia P., Ghaffari‐Tabrizi‐Wizsy N., Gribaldo L., Huang R. Y., Rasche V., Ribatti D., Rousset X., Pinto M. T., Viallet J., Wang Y., Schneider‐Stock R., Cancers 2022, 15, 191. [DOI] [PMC free article] [PubMed] [Google Scholar]
- 28. Passaniti A., Kleinman H. K., Martin G. R., J. Cell Commun. Signal. 2022, 16, 621. [DOI] [PMC free article] [PubMed] [Google Scholar]
- 29. Offner F. A., Bigalke I., Schiefer J., Wirtz H. C., Klosterhalfen B., Feichtinger H., Kirkpatrick C. J., Int. J. Cancer 1993, 54, 506. [DOI] [PubMed] [Google Scholar]
- 30. Li B., Shen W., Peng H., Li Y., Chen F., Zheng L., Xu J., Jia L., Onco Targets Ther. 2019, 12, 3207. [DOI] [PMC free article] [PubMed] [Google Scholar]
- 31. Risau W., Lemmon V., Dev Biol. 1988, 125, 441. [DOI] [PubMed] [Google Scholar]
- 32. Hu J., Ishihara M., Chin A. I., Wu L., Precis. Clin. Med. 2019, 2, 140. [DOI] [PMC free article] [PubMed] [Google Scholar]
- 33. Cimpean A. M., Rabatti D., Raica M., Angiogenesis 2008, 11, 311. [DOI] [PubMed] [Google Scholar]
- 34. Sarogni P., Mapanao A. K., Gonnelli A., Ermini M. L., Marchetti S., Kusmic C., Paiar F., Voliani V., iScience 2022, 25, 103980. [DOI] [PMC free article] [PubMed] [Google Scholar]
- 35. Butler K. S., Brinker C. J., Leong H. S., ACS Nano 2022, 16, 19626. [DOI] [PMC free article] [PubMed] [Google Scholar]
- 36. Mapanao A. K., Che P. P., Sarogni P., Sminia P., Giovannetti E., Voliani V., Expert Opin. Drug Metab. Toxicol. 2021, 17, 947. [DOI] [PubMed] [Google Scholar]
- 37. Nowak‐Sliwinska P., Segura T., Iruela‐Arispe M. L., Angiogenesis 2014, 17, 779. [DOI] [PMC free article] [PubMed] [Google Scholar]
- 38. Fergelot P., Bernhard J. C., Soulet F., Kilarski W. W., Léon C., Courtois N., Deminière C., Herbert J. M., Antczak P., Falciani F., Rioux‐Leclercq N., Patard J. J., Ferrière J. M., Ravaud A., Hagedorn M., Bikfalvi A., Angiogenesis 2013, 16, 181. [DOI] [PubMed] [Google Scholar]
- 39. Zabielska‐Koczywąs K., Wojtkowska A., Dolka I., Małek A., Walewska M., Wojtalewicz A., Żbikowski A., Lechowski R., BMC Vet. Res. 2017, 13, 201. [DOI] [PMC free article] [PubMed] [Google Scholar]
- 40. Subauste M. C., Kupriyanova T. A., Conn E. M., Ardi V. C., Quigley J. P., Deryugina E. I., Clin. Exp. Metastasis 2009, 26, 1033. [DOI] [PMC free article] [PubMed] [Google Scholar]
- 41. Xiao X., Zhou X., Ming H., Zhang J., Huang G., Zhang Z., Li P., Busson P., PLoS One 2015, 10, 0130935. [DOI] [PMC free article] [PubMed] [Google Scholar]
- 42. Dai J., Lin Y., Duan Y., Li Z., Zhou D., Chen W., Wang L., Zhang Q. Q., Int. J. Biol. Sci. 2017, 13, 660. [DOI] [PMC free article] [PubMed] [Google Scholar]
- 43. Mangieri D., Nico B., Coluccia A. M., Vacca A., Ponzoni M., Ribatti D., Cancer Lett. 2009, 277, 199. [DOI] [PubMed] [Google Scholar]
- 44. Li M., Pathak R. R., Lopez‐Rivera E., Friedman S. L., Aguirre‐Ghiso J. A., Sikora A. G., J. Vis. Exp. 2015, 9, 52411. [DOI] [PMC free article] [PubMed] [Google Scholar]
- 45. Swadi R., Mather G., Pizer B. L., Losty P. D., See V., Moss D., BMC Cancer 2018, 18, 28. [DOI] [PMC free article] [PubMed] [Google Scholar]
- 46. Lokman N. A., Elder A. S. F., Ricciardelli C., Oehler M. K., Int. J. Mol. Sci. 2012, 13, 9959. [DOI] [PMC free article] [PubMed] [Google Scholar]
- 47. Balke M., Neumann A., Kersting C., Agelopoulos K., Gebert C., Gosheger G., Buerger H., Hagedorn M., BMC Res. Notes 2010, 3, 58. [DOI] [PMC free article] [PubMed] [Google Scholar]
- 48. Ribatti D., Nico B., Pezzolo A., Vacca A., Meazza R., Cinti R., Carlini B., Parodi F., Pistoia V., Corrias M. V., Br. J. Cancer 2006, 94, 1845. [DOI] [PMC free article] [PubMed] [Google Scholar]
- 49. Fu L., Bridges C. A., Kim H. N., Ding C., Bao Hou N. C., Yeow J., Fok S., Macmillan A., Sterling J. D., Baker S. M., Lord M. S., Biomacromolecules 2024, 25, 3850. [DOI] [PubMed] [Google Scholar]
- 50. Zhu J., Liu X., Xu J., Deng Y., Wang P., Liu Z., Yang Q., Li D., Yu T., Zhu D., Cell Rep. Methods 2023, 3, 100407. [DOI] [PMC free article] [PubMed] [Google Scholar]
- 51. Lugano R., Ramachandran M., Dimberg A., Cell. Mol. Life Sci. 2020, 77, 1745. [DOI] [PMC free article] [PubMed] [Google Scholar]
- 52. Avram S., Coricovac D. E., Pavel I. Z., Pinzaru I., Ghiulai R., Baderca F., Soica C., Muntean D., Branisteanu D. E., Spandidos D. A., Tsatsakis A. M., Dehelean C. A., Oncol Rep 2017, 38, 89. [DOI] [PMC free article] [PubMed] [Google Scholar]
- 53. Watnick R. S., Cold Spring Harb Perspect. Med. 2012, 2, a006676. [DOI] [PMC free article] [PubMed] [Google Scholar]
- 54. Lord M. S., Chuang C. Y., Melrose J., Davies M. J., Iozzo R. V., Whitelock J. M., Matrix Biol. 2014, 35, 112. [DOI] [PMC free article] [PubMed] [Google Scholar]
- 55. Daetwyler S., Fiolka R. P., Commun. Biol. 2023, 6, 502. [DOI] [PMC free article] [PubMed] [Google Scholar]
- 56. Farach‐Carson M. C., Warren C. R., Harrington D. A., Carson D. D., Matrix Biol. 2014, 34, 64. [DOI] [PMC free article] [PubMed] [Google Scholar]
- 57. Liu J., Swasdison S., Xie W., Brewton R. G., Mayne R., Matrix Biol. 1998, 16, 471. [DOI] [PubMed] [Google Scholar]
- 58. Hashemi G., Dight J., Khosrotehrani K., Sormani L., Cancers 2022, 14, 4216. [DOI] [PMC free article] [PubMed] [Google Scholar]
- 59. Mabeta P., Biomed. Pharmacother. 2020, 127, 110135. [DOI] [PubMed] [Google Scholar]
- 60. Huo K. G., D'Arcangelo E., Tsao M. S., Transl. Lung Cancer Res. 2020, 9, 2214. [DOI] [PMC free article] [PubMed] [Google Scholar]
- 61. Carlino M. S., Larkin J., Long G. V., Lancet 2021, 398, 1002. [DOI] [PubMed] [Google Scholar]
- 62. Kim H. N., Elgundi Z., Lin X., Fu L., Tang F., Moh E. S. X., Jung M., Chandrasekar K., Bartlett‐Tomasetig F., Foster C., Packer N. H., Whitelock J. M., Rnjak‐Kovacina J., Lord M. S., J. Controlled Release 2023, 362, 184. [DOI] [PubMed] [Google Scholar]
- 63. Wanebo H. J., Argiris A., Bergsland E., Agarwala S., Rugo H., Cancer Metastasis Rev. 2006, 25, 279. [DOI] [PubMed] [Google Scholar]
- 64. Pink D. B., Schulte W., Parseghian M. H., Zijlstra A., Lewis J. D., PLoS One 2012, 7, 33760. [DOI] [PMC free article] [PubMed] [Google Scholar]
- 65. Asati A., Santra S., Kaittanis C., Nath S., Perez J. M., Angew. Chem., Int. Ed. Engl. 2009, 48, 2308. [DOI] [PMC free article] [PubMed] [Google Scholar]
- 66. Pešić M., Podolski‐Renić A., Stojković S., Matović B., Zmejkoski D., Kojić V., Bogdanović G., Pavićević A., Mojović M., Savić A., Milenković I., Kalauzi A., Radotić K., Chem. Biol. Interact. 2015, 232, 85. [DOI] [PubMed] [Google Scholar]
- 67. Yildirimer L., Thanh N. T. K., Loizidou M., Seifalian A. M., Nano Today 2011, 6, 585. [DOI] [PMC free article] [PubMed] [Google Scholar]
- 68. Burdon R. H., Gill V., Rice‐Evans C., Free Radical Res. Commun. 1990, 11, 65. [DOI] [PubMed] [Google Scholar]
- 69. Storz P., Front. Biosci. 2005, 10, 1881. [DOI] [PubMed] [Google Scholar]
- 70. Stine M. J., Wang C. J., Moriarty W. F., Ryu B., Cheong R., Westra W. H., Levchenko A., Alani R. M., Cancer Res. 2011, 71, 2433. [DOI] [PMC free article] [PubMed] [Google Scholar]
- 71. Shoval H., Karsch‐Bluman A., Brill‐Karniely Y., Stern T., Zamir G., Hubert A., Benny O., Sci. Rep. 2017, 7, 10428. [DOI] [PMC free article] [PubMed] [Google Scholar]
- 72. Tsunoda S., Nakamura T., Sakurai H., Saiki I., Cancer Sci. 2007, 98, 541. [DOI] [PMC free article] [PubMed] [Google Scholar]
- 73. Lin X., Tang F., Jiang S., Khamis H., Bongers A., Whitelock J. M., Lord M. S., Rnjak‐Kovacina J., Adv. Sci. 2020, 7, 2000900. [DOI] [PMC free article] [PubMed] [Google Scholar]
- 74. Thompson L. D., Pantoliano M. W., Springer B. A., Biochemistry 1994, 33, 3831. [DOI] [PubMed] [Google Scholar]
- 75. Huang K., Ma H., Liu J., Huo S., Kumar A., Wei T., Zhang X., Jin S., Gan Y., Wang P. C., He S., Zhang X., Liang X. J., ACS Nano 2012, 6, 4483. [DOI] [PMC free article] [PubMed] [Google Scholar]
- 76. Bugno J., Hsu H. J., Pearson R. M., Noh H., Hong S., Mol Pharm. 2016, 13, 2155. [DOI] [PubMed] [Google Scholar]
- 77. Sakashita S., Engvall E., Ruoslahti E., FEBS Lett. 1980, 116, 243. [DOI] [PubMed] [Google Scholar]
- 78. Chauhan V. P., Stylianopoulos T., Martin J. D., Popović Z., Chen O., Kamoun W. S., Bawendi M. G., Fukumura D., Jain R. K., Nat. Nanotechnol. 2012, 7, 383. [DOI] [PMC free article] [PubMed] [Google Scholar]
- 79. Chung Y. I., Kim J. C., Kim Y. H., Tae G., Lee S. Y., Kim K., Kwon I. C., J. Controlled Release 2010, 143, 374. [DOI] [PubMed] [Google Scholar]
- 80. Ma H. L., Jiang Q., Han S., Wu Y., Cui Tomshine J., Wang D., Gan Y., Zou G., Liang X. J., Mol. Imaging 2012, 11, 487. [PubMed] [Google Scholar]
- 81. Kim B., Han G., Toley B. J., Kim C. K., Rotello V. M., Forbes N. S., Nat. Nanotechnol. 2010, 5, 465. [DOI] [PMC free article] [PubMed] [Google Scholar]
- 82. Mitchell M. J., Billingsley M. M., Haley R. M., Wechsler M. E., Peppas N. A., Langer R., Nat. Rev. Drug Discovery 2021, 20, 101. [DOI] [PMC free article] [PubMed] [Google Scholar]
- 83. DeCarlo A. A., Belousova M., Ellis A. L., Petersen D., Grenett H., Hardigan P., O'Grady R., Lord M., Whitelock J. M., BMC Biotechnol. 2012, 12, 60. [DOI] [PMC free article] [PubMed] [Google Scholar]
- 84. Alili L., Sack M., Karakoti A. S., Teuber S., Puschmann K., Hirst S. M., Reilly C. M., Zanger K., Stahl W., Das S., Seal S., Brenneisen P., Biomaterials 2011, 32, 2918. [DOI] [PubMed] [Google Scholar]
- 85. Lord M. S., Cheng B., Tang F., Lyons J. G., Rnjak‐Kovacina J., Whitelock J. M., Metab. Eng. 2016, 38, 105. [DOI] [PubMed] [Google Scholar]
Associated Data
This section collects any data citations, data availability statements, or supplementary materials included in this article.
Supplementary Materials
Supporting Information
Data Availability Statement
The data that support the findings of this study are available from the corresponding author upon reasonable request.