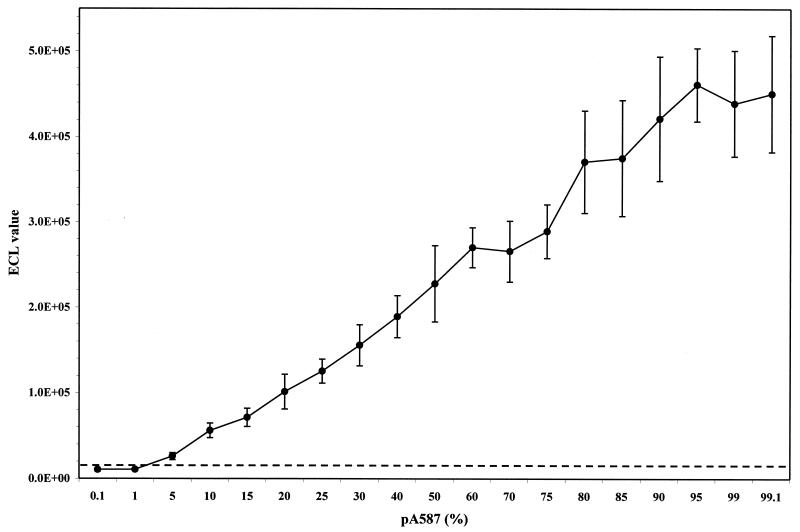
FIG. 2.
gLCR standard curve of an increasing percentage of pA587 mixed with pG587. Gel-purified, nested PCR product from pA587 was mixed in an increasing ratio with gel-purified, nested PCR product from pG587. Mixtures were then tested in duplicate or triplicate for the G145R mutation by the gLCR assay with ECL detection of gLCR products. The mean ECL value plus standard deviation is plotted at each percentage of pA587 in a background of pG587 to a total of 100%. The broken line represents the cutoff value for the assay. 1.0E+05, 1 × 10⁵; 2.0E+05, 2 × 10⁵; 3.0E + 05, 3 × 10⁵; 4.0E + 05, 4 × 10⁵; 5.0E + 05, 5 × 10⁵.

