

Abstract
Sickle cell disease (SCD) is among the most prevalent genetic disorders worldwide. It is characterized by unpredictable and potentially fatal vaso-occlusive crises, directly linked to the stiffening of red blood cells (RBCs) due to the formation of hemoglobin fibers in their cytoplasm. Here, we propose a new mechanical marker: the proportion of RBCs in a blood sample deformable enough to exhibit a specific tank-treading motion, in shear flow at a given shear rate. This marker is significantly lower in SCD patients than in controls and is sensitive to RBC density and dehydration, two factors that influence hemoglobin polymerization in SCD. The marker was tested in a cohort of 21 SCD patients, with weekly monitoring conducted over a period of 6 months. It correlates with key biological parameters of SCD including fetal hemoglobin levels, reticulocyte count, serum LDH levels, and the use of antihypertensive treatments. The marker significantly decreases before vaso-occlusive crises requiring hospitalization. These findings indicate that this marker may act as a comprehensive indicator of RBC deformability, offering valuable insights for the continuous clinical monitoring of SCD patients. It could play a role in managing or preventing vaso-occlusive crises and holds potential for the development of new diagnostic tests such as point-of-care or companion diagnostic devices for personalized medicine.
Supplementary Information
The online version contains supplementary material available at 10.1038/s41598-025-00152-w.
Keywords: Sickle cell disease, RBC motion, RBC deformability, Vaso-occlusive crisis, Shear flow, Red blood cell density
Subject terms: Biological physics, Sickle cell disease, Biomarkers
Introduction
Sickle Cell Disease (SCD) is the most prevalent and highly debilitating genetic blood disorder. It affects nearly eight million people worldwide1, with a heavy daily burden and a life expectancy reduced by 30 years2. Today, there is a pressing medical need for new markers, relevant standards of care and diagnostic tools to improve treatment and comprehensive long-term care for patients3. SCD is characterized by hemolytic anemia and unpredictable vaso-occlusive crises (VOC), which are acute, painful, potentially fatal episodes, and deleterious for organs4. A key factor in the pathophysiology of SCD and a determinant of clinical outcome, including VOC occurrence5,6, is the obstruction of blood flow in capillaries by stiffened and adherent red blood cells (RBCs). It is caused by the sickle hemoglobin (HbS), a variant of the oxygen-carrying protein hemoglobin (Hb) found in red blood cells (RBCs). Sickle hemoglobin polymerizes into fibers within RBCs when they pass through a partially deoxygenated area, or in the event of dehydration, which stiffens them, deforming them into a sickle shape and preventing them from squeezing into small blood capillaries. In addition, the RBC cytoskeleton is remodeled by a specific biochemical interaction of HbS with the RBC membrane, further reducing their deformability7,8. Moreover, even after reoxygenation, HbS polymerization is only partially reversible. This leads to a continuous decline in red blood cell deformability over successive deoxygenation/reoxygenation cycles, which adds up to the reduction of deformability induced by RBC aging. The result is a wide variation in deformability among SCD RBCs, due to the circulation of RBCs of various ages that have undergone a variable number of deoxygenation/reoxygenation cycles5,6,9–11.
A marker of RBC deformability is therefore a relevant candidate for SCD monitoring. Nevertheless, measuring RBC deformability is difficult in routine use. Indeed, RBCs are small biconcave structures, 8 µm in diameter by 2 µm thick, whose deformability depends on two factors: the viscosity of the hemoglobin solution in their cytoplasm, and the flexibility/rigidity of their composite membrane (See Supp. Table S1 for details on the mechanical properties of control and SCD RBCs). To date, current methods developed to assess RBC deformability in blood samples remain suboptimal. The most widely used technique, ektacytometry, is based on the analysis on the average elongation of thousands of RBCs subjected to a constant extensional force. It is therefore primarily sensitive to the cell membrane flexibility alone. The limitations of this technique in SCD12 led to the development of the more complex-to-use oxygen gradient ektacytometry, that requires a continuous variation of oxygen content13,14 to assess RBC deformability. Interesting single cell techniques, such as optical tweezers, micropipette aspiration, Atomic Force Microscopy or electrode formation are low throughput and require single-cell handling and high-level technical expertise. Recent advances in microfluidics have given rise to several new methods for measuring RBC deformability, which are extensively described and compared in a recent review and the references therein15. But the ultimate solution remains elusive. For example, methods measuring deformations of cells subjected to a shear or elongation force are not sensitive to cytoplasmic viscosity, a key point of SCD. Alternative methods measuring deformation dynamics or pressure variations often require expensive high-speed cameras or highly qualified personnel. Passage through very narrow constrictions (5 µm) requires prior removal of leukocytes from blood samples and precise micron-scale control, which poses significant implementation challenges. Finally, very few of these methods have been tested in the context of a clinical trial in SCD, leaving a real medical need unmet.
Here, we propose a simple mechanical marker and a method for measuring it, with novel features that are particularly well suited to measurement in real-life medical environments. Firstly, the marker, which is determined from the motion of RBCs in a moderate shear flow, is measured on single cells by direct observation and is sensitive to both membrane shear elasticity and cytoplasmic/membrane viscosity. The motion of each RBC is imaged individually, enabling fine characterization of their individual deformability. Secondly, the method requires only 3 µl of capillary blood taken from pinprick or from a conventional blood tube and can be implemented by an unskilled operator, or by the patient himself, and, finally, the device contains no sophisticated elements (simple camera operating at video frequency, millimeter-scale flows, natural atmosphere).
The originality of the method is to exploit the fact that the movement of an individual RBC under shear flow, discernible through video analysis, serves as an indicator of its deformability16–20. The relation between the type of movement of a RBC subjected to a moderate shear flow and its mechanical properties has been extensively studied during the past fifteen years, experimentally, numerically and theoretically16–19,21. To sum up, in a high viscosity medium (typically 40 mPa s), the RBC movement transitions as the flow shear rate increases, progressing from a rigid-like flip-flopping motion to a rolling motion resembling a wheel. Beyond a critical shear rate, the motion evolves into a stationary droplet-like tank-treading motion18,19,21–25. The more deformable the cell, the lower the critical shear rate. The critical shear rate is determined by first, the aspect ratio of the RBC (ratio between the long and the short axis of the cell), second, the cytoplasmic and membrane viscosity and third, the shear modulus at the stress-free cell membrane. A recent study showed that the critical shear rates observed on hundreds of RBCs under normal oxygenation were higher in SCD patients than in controls. This was attributed to the existence of small fibers of polymerized hemoglobin in the cytoplasm leading to increased cytoplasmic viscosity in SCD RBCs, even when they maintain a discoid shape26.
In our approach, we use the notion that a given shear rate corresponds to a RBC deformability threshold above which the cell is sufficiently deformable to exhibit tank-treading. Thus, the fraction of tank-treading RBCs functions as an indicator of the overall deformability of the RBC sample. We demonstrate that this marker significantly distinguishes between control and SCD samples. Furthermore, by performing repeated weekly measurements on a cohort of 21 SCD patients over a 6-month period, we explore the correlation of this marker with biological parameters and clinical events, examining its potential utility for patient monitoring during steady state and VOC.
Methods
Blood samples
Two groups of samples were analyzed. Prior to enrollment, all participants were informed of the study’s nature and purpose. Written consents were obtained, ensuring that participants’ contributions were voluntary. All experiments were performed in accordance with relevant guidelines and regulations.
First, the samples from 21 adult symptomatic patients with SCD enrolled in the Drepaforme study (approved by the Institutional Review Board “Comité de Protection des Personnes Ouest VI” under the reference n°2018A00679-46). The study selected patients who experienced at least one CVO during the past year. Exclusion criteria were (i) to be enrolled in a transfusion program (ii) to have been treated by bone marrow transplant during childhood (iii) to be pregnant. This cohort thus represents a homogenous group of moderately symptomatic patients experiencing less than 3 crises per year. Capillary blood samples were collected at the enrolment and then once a week for 6 months. The demographics parameters such as age and gender, RBC characteristics such as Mean Corpuscular Volume (MCV) and Mean Corpuscular Hemoglobin Content (MCHC), total Hb level and Hb fraction distribution, and markers of hemolysis such as reticulocytes count and Lactate DeHydrogenase (LDH) were recorded at the date of enrolment. LDH was preferred over indirect bilirubin as a marker of hemolysis because total bilirubin levels were within the normal range in 8 out of 21 patients, and indirect bilirubin is not measured when total bilirubin is normal. Additionally, none of the patients had liver dysfunction, as assessed by ASAT/ALAT levels. In addition, we recorded 5 qualitative data: the presence of thalassemia trait (defined as heterozygosity for beta-thalassemia or homozygosity for the alpha-3.7 kb deletion), treatment with hydroxyurea, Angiotensin Converting Enzyme (ACE) inhibitors or other anti-hypertensive drugs and the presence of organ complications. Once a week, during sampling for the measurement of the fraction of tank-treading RBCs, the patient was asked to indicate if, during the past week, she/he has faced pain crisis (if yes, number of pain localisation, duration, hospital admission), fever (if yes, duration) and if she/he has taken an antalgic drug (if yes, name, dose and duration).
Second, 55 other specimens were a subset of residual samples collected in EDTA tubes and referred to the Department of Genetics (Hôpital de La Timone, Marseille, France) for routine follow-up of the hemoglobin fractions. These specimens were from 23 SCD patients, homozygous for HbS or compound heterozygous for HbS and beta0-thalassemia mutation (noted HbSS) and were all adult subjects followed in the Department of Internal Medicine (Hôpital de La Timone, Marseille, France), 3 subjects heterozygous for HbS (noted HbAS) and 12 individuals with normal Hb profiles (noted HbAA). None of the SCD patients was under transfusion exchange. For SCD patients, steady state was defined as no blood transfusion within 90 days, no VOC within 30 days and free from pregnancy.
A VOC was defined as the onset of new pain affecting at least two locations, ± fever > 38.3 °C, ± dyspnea and/or sputum, requiring hospitalization.
Sample preparation
For experiments in standard hydration condition, Dextran (from Leuconostoc mesenteroides, 2000 kDa, Sigma-Aldrich) was solubilized at 9% (wt/wt) in DPBS + glucose (40 mM) at an osmolarity of 295 ± 5 mOsm (controlled by adding glucose) and pH = 7.4, by stirring at 50 °C for at least 2 h. The Dextran solution has a viscosity  39.2 ± 0.7 10–3 Pa s at 20 °C and its density approximately matches that of RBCs thus preventing cell sedimentation. Dehydration experiments were conducted using hyper-osmotic PBS buffers (up to 600 mOsm) prepared by proportionally concentrating all reagents in PBS.
For capillary samples: the blood was taken via pinprick (3 µL) and diluted in 1 ml dextran solution. Then diluted by a factor of 25 in the same dextran solution before analysis.
For venous samples: RBCs were isolated within 24 h by three consecutive washing steps in SAG-mannitol (SAGM, EFS, France) at a centrifugation rate of 500 g (10 min at 4 °C), suspended in SAGM at 50% hematocrit, stored at 4 °C, and used within 7 days. Just before use, RBCs suspended in SAGM were diluted (≈ 500 ×) in dextran solution. For a series of experiments, Percoll density gradients were used to separate blood samples into RBC density fractions right after collection (See Supp. Info. 2, Figs. S1, S2 for detailed density sorting protocol and characterization of density layer).
Flow experiments, microscopy, and measurement of the fraction of tank-treading RBCs
Flow experiments were performed as described previously27,28. RBCs diluted in dextran solution were injected in a parallelepiped quartz flow chamber (50 × 10 × 1 mm3, Hellma, France) mounted on an inverted microscope (DMIRB, Leica). The fluid was driven by a syringe pump (11 Plus, Harvard Apparatus) at controlled wall shear rate  (ranging from 1 to 20 s−1). RBCs were observed in bright-field microscopy (20 × objective) 2 cm away from the entrance of the chamber, at 50 µm or 60 µm from the bottom wall (zone of constant shear rate) along the direction of the flow gradient. All experiments were performed at room temperature (21 ± 2 °C) without hypoxia. The videos of RBCs crossing the camera field (830 × 655 μm2) were recorded directly on the computer at 25 or 42 fps with cameras (Photonfocus or Infinity 3-6UR, QImaging). Each video image displays the projection of the cell along the direction of the flow gradient. When the cell tank-treads, it keeps a fixed orientation, and its projection remains the same over time. When the cell flips, its orientation with the flow direction periodically varies with time, resulting in temporal changes in the shape of its projection. Video images were processed automatically using in-house Matlab routines to segment and track individual RBCs (see Supp. Fig.S3), and then, the regime of motion of each RBC was determined directly by observation. For each measurement, 250 to 2000 RBCs were observed and classified as tank-treading or not, and the fraction of tank-treading RBCs, fTT, was calculated. The fraction fTT was defined as the ratio of tank-treading RBCs to total flowing RBCs that are in focus, i.e. when motion type can be determined.
Summary of practical implementation
Take 3 µl of blood from the patient’s fingertip and homogenize in 1 ml of dextran
It is then diluted by a factor of 25 and injected by a syringe pump into a millimeter-scale flow chamber.
An optical system (white light focused by a condenser and × 20 objective connected to a camera allows to record the movies of red blood cells in flow directly on a computer.
The video images are processed and the image sequences for each red blood cell crossing the camera field are automatically visualized. The classification is carried out by the user (or a specifically developed algorithm).
Statistical analysis
The statistical analysis was performed using SPSS software.
The descriptive analysis of the variables was done by central tendency and dispersion characteristics (mean (m), median (me), min, max, 1st and 3rd quartiles, standard deviation (σ) as well as determination of confidence intervals (CI 95%) around the mean), for quantitative variables and by the determination of frequencies for the qualitative variables.
The t-test was used for the comparison of the means of two independent groups; for small sample size groups, the comparison was carried out using non-parametric tests, the Wilcoxon-Mann–Whitney and Kruskal–Wallis tests. A paired Student’s t-test was used to compare the fTT in the same individual during hospitalization for VOC.
The slope (linear regression) and Pearson correlation (performed using bilateral significance test) tests were used to estimate the relationship between two quantitative variables. A relationship was considered significant if the p-value was < 0.05. To investigate the relationship between fTT (repeated data) and factors, we performed a GEE (generalized estimating equations) model in univariate, then multivariate. The significance level was set at the alpha level equal to 0.05.
Results
The fraction of tank-treading RBCs is lower in SCD patients than in heterozygous HbAS and in controls.
For each blood sample, the individual motion of RBCs suspended in dextran solution under shear flow was followed as illustrated in Fig. 1. Figures 1A and B respectively show the experimental setup and an image of the field of view. Tank-treading RBCs were distinguishable as they had a quasi-circular shape with a small dimple in the cell center and kept a stable orientation as compared to rolling (elongated shape) and flip-flopping (non-stationary orientation) RBCs (Fig. 1C).
Fig. 1.

Flow experiment and fraction of tank-treading RBCs. (A) Flow experiment schematics. RBC motions are recorded at ~ 50 µm from the flow chamber bottom. (B) Image of a field of view (660 × 571 µm2) with flowing RBCs, observed along the flow gradient (shear plane). Scale bar: 50 µm. Each RBC is tracked in the field of view and its individual motion is extracted. (C) Typical time-lapses of a flip-flopping RBC (bottom) and a tank-treading RBC (top). (D) Fraction of tank-treading RBCs, fTT, with shear rate  for 3 control (HbAA) and 3 homozygous SCD (HbSS) samples. fTT(
 ) is the cumulative curve of the deformability distribution of an RBC population. Lines are guides to the eyes to differentiate measurements specific to each patient. The grey zone above 10 s−1 corresponds to shear rates high enough for fTT in all control samples to reach the plateau value around 0.9. In contrast, in that zone, fTT of SCD patient samples ranges from 0.4 to 0.8. (E) fTT (mean ± SD) at
  = 15 s−1 averaged over 11 HbAA, 3 heterozygous HbAS, and 19 homozygous SCD samples. A strong inter-SCD patient variability in fTT (mean fTT value of 0.73 ± 0.10) and a significant difference (p-value < 0.0001, unpaired Student T-test) with both controls and HbAS (mean fTT values of 0.99 ± 0.01 and 0.98 ± 0.01, respectively) were observed.
We first determined the fraction of tank-treading RBCs, fTT, for increasing values of the shear rate  , in samples from three SCD patients and three controls. As expected, fTT increased with the shear rate for both types of samples because at high shear rates, tank-treading is easy to adopt even by poorly deformable RBCs (Fig. 1D). These fTT versus
  curves are the cumulative curves of tank-treading RBCs reflecting the deformability distribution of an RBC population. While the three control samples behaved quite similarly with fTT values larger than 0.9 for a shear rate
  ≥ 6 s−1, the three SCD samples displayed lower values of fTT whatever the shear rate, with a strong inter-patient variability (Fig. 1D). Especially for the highest values of shear rate, for which almost all control cells tank-treaded, fTT from SCD patients reached a plateau value of 82% at a maximum. This behavior showed that the proportion of deformable RBCs was lower in SCD patients than in controls. In the rest of this experiment, the measurements of fTT were performed at 15 s−1 i.e. at a shear rate high enough for fTT of control RBCs to reach the plateau value (shown as a gray zone Fig. 1D). This shear rate value corresponds to a shear stress
  of 0.6 Pa and is in the range of the lowest physiological wall shear stresses29. Figure 1E shows fTT values measured on controls, heterozygotes persons and SCD patients in steady state. A strong inter-SCD patient variability in fTT (mean fTT value of 0.73 ± 0.10) and a significant difference (p-value < 0.0001, unpaired Student’s T-test) with both controls and HbAS (mean fTT values of 0.99 ± 0.01 and 0.98 ± 0.01, respectively) were observed. These results showed that an average of 30% of SCD RBCs were little deformable. At the selected shear rate, fTT is a parameter that clearly differentiates the SCD RBC population from the control and the HbAS RBC populations.
The fraction of tank-treading RBCs is sensitive to cell density and water content in control and SCD patients
The sensitivity of fTT to RBC density and water content was then investigated as these parameters are known to affect RBC deformability and to be modified during the clinical course of SCD and especially during VOC30–36. Blood residual samples from two controls and two SCD patients were sorted by density (Fig. 2A) into four layers, L1 to L4, with average densities of 1.089, 1.097, 1.104, and 1.115, respectively (See Supp. Info. 2, Figs. S1 and S2 for details). As expected, a fifth layer with a density above 1.122 was found in SCD patients, revealing an additional population of very dense RBCs. As shown in Fig. 2B, fTT showed a marked decrease with increasing density, for both control and SCD samples, with a more drastic decrease in the case of SCD, with values below 0.5, and almost 0 for the densest fraction. This result shows that fTT is very sensitive to RBC density.
Fig. 2.

Sensitivity of fTT to cell density and water content. (A) Typical images of RBC layers from control (HbAA) and SCD (HbSS) blood samples after sorting in discontinuous Percoll gradients of increasing density d. (B, C) Evolution of fTT at  = 15 s−1 as a function of RBC average density (layers L2 to L5) for two control (HbAA) and two SCD (HbSS) samples (B), and as a function of external osmolarity (figuring RBC dehydration) for one control (HbAA) and one SCD (HbSS) sample (C). In (B) the last point on the right corresponds to a RBC density higher than 1.122 (L5). fTT decreases with the cell density and water content for both control and SCD samples; the values of fTT of SCD samples always remain below those of the controls.
The fTT dependence on the RBC internal water content figuring the state of RBCs hydration was measured on one control and one SCD patient. Dehydration was achieved through gradual hyper-osmolarity of the external medium, starting from the physiological value of 300 mOsm up to 600 mOsm. Figure 2C shows that fTT dramatically decreased with dehydration in both control and SCD populations, with the SCD fTT remaining lower than the control fTT in any hyper-osmotic conditions. This result shows that fTT is sensitive to RBC dehydration, a phenomenon associated with RBC sickling in SCD patients.
fTT correlates with fetal hemoglobin, reticulocyte count, and serum LDH level in SCD patients
The correlation of fTT, measured at patient inclusion at  = 10 s−1 (shear stress of 0.4 Pa) with several biological parameters was studied on a cohort of 21 SCD patients. The quantitative biological parameters, all measured at the time of patient enrolment, were: age, Hb concentration, MCV, percentage of fetal hemoglobin (HbF), reticulocyte count and serum LDH level (see Table 1 for the cohort description).
Table1.
Cohort description at the time of inclusion: (a) quantitative variables; (b) qualitative variables.
| (a) | N | Mean (median; quartiles) | (b) | N (%) |
|---|---|---|---|---|
| Age (y) | 21 | 34.9 (34.0; 24.5–45.5) | Thalassemia Trait | 8 (44.0) |
| Hb (g/l) | 21 | 85.4 (82.0; 74.5–93.5) | Hydroxyurea treatment | 13 (62.0) |
| MCV (fl) | 21 | 83.1 (81.7; 74.0–94.5) | ACE inhibitors | 3 (14.3) |
| HbF (%) | 21 | 14.6 (14.9; 7.2–21.0) | Other Anti hypertensive drugs | 3 (14.3) |
| Reticulocyte count (G/l) | 20 | 180.3 (177.5; 119.0–231.5) | Organ Complications | 10 (47.6) |
| LDH UI/l | 18 | 435.0 (373.5; 316.5–559.0) |
Pearson correlation was performed using bilateral significance test. While no correlation was found between fTT, total Hb level, age, and MCV, a positive correlation of fTT was obtained with the percentage of HbF (Table 2). It reflects the known beneficial effect of high level of HbF on RBC deformability by inhibiting the polymerization of deoxy-sickle hemoglobin. In addition, a strong negative correlation of fTT with the reticulocyte count and with the plasma LDH level was obtained, suggesting that a higher hemolysis rate is associated with a lower RBC deformability37. As expected, there was also a negative correlation of HbF with the reticulocyte count and LDH level and the positive correlation between the two latest parameters.
Table 2.
Pearson correlation between fTT (measured at patient inclusion) and quantitative biological parameters.
| Correlation with fTT | N | Pearson correlation | p-Value |
|---|---|---|---|
| Age | 21 | − 0.087 | 0.708 |
| Hb (g/l) | 21 | 0.164 | 0.479 |
| VGM (fl) | 21 | 0.365 | 0.103 |
| HbF (%) | 21 | 0.448 | 0.042 |
| Reticulocytes (G/l) | 20 | − 0.669 | 0.001 |
| LDH UI/l | 18 | − 0.504 | 0.033 |
Significant values are in [bold].
fTT correlates with pain level and antihypertensive treatments
The correlation of fTT (measured at a shear rate of 10 s−1) with qualitative clinical parameters (pain level, organ complications, hydroxyurea treatment, ACE treatment and other antihypertensive drugs, and thalassemia trait) was studied from fTT values measured weekly over a 6-month period in 19 of the 21 patients enrolled in the study (two patients were excluded because they had less than five samplings). These 19 patients had between 7 and 23 samplings over the 6-month period (See Supp. Table S2). The sets of fTT values differed statistically between patients (p < 0.05, Kruskal–Wallis test for interpatient data pairs). The mean and standard deviations of intra-patient fTT values were in the range 0.466–0.852 and 0.035–0.104, respectively.
Table 3 shows the results of univariate and multivariate analyses. In this case, the average of all the fTTs of all the patients in relation to certain characteristics was used. The pain level was reported weekly by the patient according to three levels defined as follows: 0 for no pain, 1 for pain managed at home, and 2 for pain management requiring hospitalization for VOC. A significant difference in fTT values was observed between pain level 0 and level 2, with mean fTT values being lower when patients experienced level 2 pain, indicating a lower average deformability of their RBCs. A positive correlation between antihypertensive drugs and fTT values was found with both ACE inhibitors and other antihypertensive drugs by univariate analysis and, for the latter, also by multivariate analysis. This was unexpected as these drugs are used to prevent renal damage and not to act on RBC deformability. No correlation was found between fTT values and hydroxyurea treatment. This is consistent with the fact that there was no difference in HbF levels between the group of patients treated with hydroxyurea when compared to those without treatment (data not shown).
Table 3.
Univariate and multivariate analyses on weekly repeated fTT measures.
| Characteristic | Univariate analysis | Multivariate analysis | ||||
|---|---|---|---|---|---|---|
| Mean fTT | SE | p | Mean fTT | SE | p | |
| Thal Trait | ||||||
| No | 0.78 | 0.02 | 0.126 | |||
| Yes | 0.73 | 0.03 | ||||
| Pain | ||||||
| 0 | 0.76 | 0.01 | 0.005 | 0.79 | 0.01 | 0.047 |
| 1 | 0.74 | 0.03 | 0.76 | 0.02 | ||
| 2 | 0.68 | 0.02 | 0.76 | 0.03 | ||
| Complications | ||||||
| No | 0.75 | 0.012 | 0.600 | |||
| Yes | 0.76 | 0.03 | ||||
| Hydroxyurea | ||||||
| No | 0.73 | 0.03 | 0.336 | |||
| Yes | 0. 76 | 0.01 | ||||
| ACE Inhibitor | ||||||
| No | 0. 74 | 0.01 | 0.005 | 0.76 | 0.01 | 0.429 |
| Yes | 0. 81 | 0.02 | 0.78 | 0.03 | ||
| Other anti-hypertensive drug | ||||||
| No | 0. 74 | 0.01 | 0.056 | 0.73 | 0.02 | 0.008 |
| Yes | 0. 80 | 0.02 | 0.80 | 0.02 | ||
Significant values are in [bold].
Kinetics of fTT in steady state and during vaso-occlusive crises
The fTT fraction was systematically measured at a shear rate of 10 s−1 once a week for 19 patients and during a hospitalized VOC for seven patients. Figure 3 illustrates the kinetics of weekly-measured fTT values in three patients who remained in steady state during the 6-month period (Fig. 3A), and in three patients who faced one VOC during this period (Fig. 3B). For these latter three patients, the fTT values measured during the VOC were always lower than the mean fTT measured during the steady state minus twice the standard deviation (The grey zones in Fig. 3 covers the region mean ± 2 standard deviations (SD)). Blood samples of four additional patients were analyzed during a hospitalization period for 5 VOCs. For these patients, the steady state fTT was not available, but two fTT measurements were performed at least 12 h apart during the crisis. fTT on arrival at the hospital were all under 0.77 and significantly increased during VOC resolution 12–36 h after arrival at the hospital (Fig. 4).
Fig. 3.

fTT measured weekly for 6 SCD patients over the 6-month period. (A) Patients in steady state over the period. All the values of fTT are contained in the grey zones which represent for each patient the mean ± 2 standard deviations (SD). (B) Patients hospitalized due to VOC during the period. fTT values during VOC are highlighted in red and are always smaller than the mean fTT value—2 × SD.
Fig. 4.
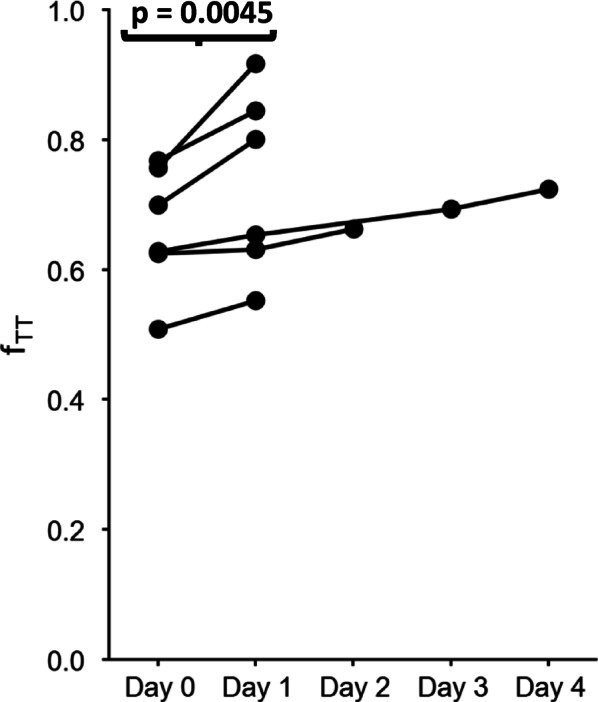
Evolution of fTT during VOC resolution. Day 0 corresponds to fTT value at the time of hospital admission and Day 1 to 4 to the fTT value between 12 and 36 h after the measure of the previous day. For each patient, the fTT value at Day 1 is increasing from Day 0.
Altogether, decrease in fTT can be interpreted as the stiffening of an increasing population of RBCs, one of the factors leading to VOC. At the VOC onset, stiff RBCs are trapped in the microcirculation before being gradually eliminated during VOC resolution. At the VOC exit, the proportion of more flexible RBCs gradually increases, leading to a higher fTT.
Discussion
In this study, we introduce a mechanical marker that provides a straightforward and reliable method for assessing RBC deformability using small blood samples under normoxic conditions. This method is particularly suitable for investigating deformability in populations of RBCs from SCD patients.
VOCs result from reduced RBC deformability and membrane modifications, coupled with non-RBC factors such as endothelial dysfunction, inflammation, and increased oxidative stress31. They are the primary risk factor for potentially life-threatening complications. Overall, SCD adult patients experience a mean of 0.7–0.8 crisis/year when considering only VOC with inpatient treatment32,38 but this estimation does not reflect the clinical course variability in SCD with around 40% patients living almost symptom free while others suffering from frequent pain crises with various frequencies33,39.
The fTT values of SCD patients, measured in steady state, consistently remained below 85% while the lower fTT measured in controls is 96%. Despite the relative clinical homogeneity, fTT varied between 46 and 85% among the SCD patients.
We examined the influence of various parameters on fTT values, particularly investigating the effects of cell density and dehydration level. Both parameters are known to correlate with HbS polymerization and consequently impact SCD RBC deformability. The results confirmed that the fTT marker is sensitive to cell density and is particularly low in the fraction of dense RBCs specific of SCD. These dense RBCs, defined as density > 1.11, are characterized by an increased stiffness and are present at percentages that vary from a patient to another35. The occurrence of several organ complications has been correlated to a high percentage of dense RBCs in SCD patients35,36,39 and, additionally, hydroxyurea is known to decrease the percentage of dense RBCs in hydroxyurea-treated patients40,41. Although the presence of dense RBCs is an interesting marker, its use in clinical practice is prevented by the time-consuming procedure and the need for several milliliters of samples to perform the RBC fractionation. fTT indirectly reflecting the percentage of dense RBCs could serve as an alternative to this parameter. Cell dehydration also is an important contributor to SCD pathophysiology through the promotion of HbS polymerization and sickling42. The modulation of hydration level has been considered as a potential therapeutic approach. Here, we showed that fTT decreases with dehydration, indicating a possible application in monitoring drugs modulating RBC hydration.
The study also unveiled a positive correlation between fTT and HbF level, aligning with the known protective effect of HbF against HbS polymerization and clinical complications. Up to now, HbF measured in the first month of life has been the most reliable marker for predicting disease severity43.
As expected, markers of hemolysis, such as reticulocyte count and LDH level, which are associated with a severe disease course in SCD, also showed a correlation with fTT, indicating that the marker could reflect several biological markers significantly correlated with SCD severity. Given that the present study only concerns moderately affected patients, further studies including severe patients and children before the introduction of disease-changing treatments such as bone marrow transplant or transfusions are needed to determine if this parameter could serve as a long-term predictor of disease severity. For example, studying samples from infants and children will be valuable to extend our findings to all SCD patients and for expanding the range of biomarkers and genetic modifiers that can help predict overall disease severity and guide treatment strategies early in life. Notably, no correlation was observed with MCV values or the presence of a thalassemia trait in the studied cohort of SCD patients, suggesting that HbS impact on deformability overcomes the potential impact of globin chains imbalance observed in thalassemia trait.
Surprisingly, a higher fTT was associated with the use of antihypertensive drugs, a treatment administered to prevent SCD nephropathy. In accordance, two recent studies described a protective effect of antihypertensive treatment: Agbakou et al.44 reported a significant decreased risk of adverse outcome (define as death or need for life-sustaining therapies) during severe VOCs in patients under ACE treatment and Wamkpah et al.45 reported a lower readmission time for Acute Chest syndrome in patients under ACE or Angiotensin II Receptor blockers. Given the limited number of patients undergoing antihypertensive treatment in our study, it is challenging to rule out the influence of confounding factors. Prospective clinical studies are required to confirm and document this potential protective effect.
While numerous studies aim to identify markers for the long-term outcome of SCD, predicting the rate of future VOC occurrences, very few studies focus on predicting immediate future VOC occurrence or VOC evolution into severe complications. Stankovic-Stojanovic et al.46 showed that high LDH level at admission for VOC is predictive of a higher risk of severe outcome. Our results demonstrated a significant negative correlation between fTT and inpatient-required pain crises, as opposed to pain crises manageable at home. This suggests the potential use of fTT as an objective biomarker for guiding medical interventions or hospital admission decisions in the early phase of VOC. Measuring fTT in the hours preceding VOC occurrence poses challenges since these events are currently unpredictable. At the earliest, we could measure fTT at the time of hospital admission in three patients (i.e. at an early step of VOC) and found very low values suggesting a potential decrease in fTT value before clinical symptoms occurrence. If confirmed, this finding could pave the way for predicting short-term VOC occurrence and possibly developing strategies to prevent them. Additionally, we observed that fTT increased with VOC resolution and returned to steady state levels shortly after, suggesting that fTT increase to the steady-state range of values could be a marker of VOC remission.
Previous studies using Oxygen gradient ektacytometry have shown that reduced RBC deformability in a steady state is correlated with a higher incidence of organ complications or VOC frequencies14,39 and that VOCs are associated with changes in RBC deformability, both under normoxic and hypoxic conditions47. However, Oxygen gradient ektacytometry is constrained in its capacity to measure deformability at the individual cell level, providing solely an average index of RBC deformability, which may not comprehensively represent the heterogeneity within the RBC population—particularly crucial in the context of SCD47. Additionally, the necessity for precise control of oxygen pressure during the analysis leads to a more intricate device than the one we propose. Nonetheless, these findings underscore the importance of evaluating deformability as a feasible approach for identifying crisis-related biomarkers.
In conclusion, our results suggest that fTT could serve as a valuable global marker of RBC fitness for close clinical follow-up of SCD patients, with a potential in aiding the assessment of treatment efficacy or compliance. The fTT marker could be ideally suited for point-of-care applications in the management of certain chronic diseases, and as a companion test for diagnosis and monitoring. It could be integrated into an easy-to-use monitoring device. Indeed, the device does not require delicate techniques to be implemented: for example, there are no microfluidic channels that are prone to obstruction, nor oxygen concentration control. There is no oxygen cylinder or laser requiring specific safety measures. The device is amenable to miniaturization. It can be developed in fixed and portable configurations, designed to rapidly assess red blood cell deformability using a minimal volume of blood. This device could be particularly well suited for emergency scenarios where the availability of a rapidly measurable biomarker is essential to make rapid and effective clinical decisions. Regarding the prognostic interest for overall outcome (including VOC), the marker fTT is associated with parameters that change at a slow rate, such as HbF and reticulocyte count, which are valuable for assessing steady-state conditions to predict long-term severity33,48,49. Additionally, it is sensitive to rapidly changing parameters, such as dehydration, which could be important for predicting short-term events like VOC. Lastly, fTT may be a candidate marker for other diseases associated with RBC stiffening, not only of genetic cause such as SCD but also of infectious origin, such as malaria or sepsis.
Electronic supplementary material
Below is the link to the electronic supplementary material.
Acknowledgements
This work has been carried out thanks to the support of the A*MIDEX project Interdisciplinarite (n° ANR-11-IDEX-0001-02) funded by the investissements d’Avenir French Government program, managed by the French National Research Agency (ANR) and CNRS for “prematuration” support. The authors would like to thank the patients who participated in the study, C. Jebane for collecting data, and M. Leonetti for viscosity measurements.
Author contributions
A.V. and C.B. devised and supervised the study. Performed experiments and collected data: S.A., A.H., M.S., N.B.P., I.A., M.C. Was in charge of the patients and provided key expertise: E.B. Analyzed the data: S.A., A.C., E.H., C.B., A.V. Wrote the paper: S.A., C.B., A.C., E.H., E.B., A.V.
Data availability
The data that support the findings of this study are not openly available due to reasons of sensitivity and are available from the corresponding author upon reasonable request.
Declarations
Competing interests
The authors declare no competing interests.
Footnotes
Publisher’s note
Springer Nature remains neutral with regard to jurisdictional claims in published maps and institutional affiliations.
Catherine Badens and Annie Viallat contributed equally to the study.
References
- 1.Thomson, A. M. et al. Global, regional, and national prevalence and mortality burden of sickle cell disease, 2000–2021: A systematic analysis from the Global Burden of Disease Study 2021. Lancet Haematol.10, e585–e599 (2023). [DOI] [PMC free article] [PubMed] [Google Scholar]
- 2.Lubeck, D. et al. Estimated life expectancy and income of patients with sickle cell disease compared with those without sickle cell disease. JAMA Netw. Open2, e1915374 (2019). [DOI] [PMC free article] [PubMed] [Google Scholar]
- 3.Piel, F. B. et al. Defining global strategies to improve outcomes in sickle cell disease: A lancet haematology commission. Lancet. Haematol.10, e633–e686 (2023). [DOI] [PMC free article] [PubMed] [Google Scholar]
- 4.GBD 2021 Sickle Cell Disease Collaborators. Global, regional, and national prevalence and mortality burden of sickle cell disease, 2000–2021: a systematic analysis from the Global Burden of Disease Study 2021. Lancet. Haematol.10, e585–e599 (2021). [DOI] [PMC free article] [PubMed] [Google Scholar]
- 5.Chien, S., Usami, S. & Bertles, J. F. Abnormal rheology of oxygenated blood in sickle cell anemia. J. Clin. Invest.49, 623–634 (1970). [DOI] [PMC free article] [PubMed] [Google Scholar]
- 6.Nash, G. B., Johnson, C. S. & Meiselman, H. J. Mechanical properties of oxygenated red blood cells in sickle cell (HbSS) disease. Blood63, 73–82 (1984). [PubMed] [Google Scholar]
- 7.Diez-Silva, M., Dao, M., Han, J., Lim, C. T. & Suresh, S. Shape and biomechanics characteristics of human red blood cells in health and disease. MRS Bull.35, 382–388 (2010). [DOI] [PMC free article] [PubMed] [Google Scholar]
- 8.Kuypers, F. A. Hemoglobin s polymerization and red cell membrane changes. Hematol. Oncol. Clin. North Am.28, 155–179 (2014). [DOI] [PubMed] [Google Scholar]
- 9.Byun, H. S. et al. Optical measurement of biomechanical properties of individual erythrocytes from a sickle cell patient. Acta Biomater.8, 4130–4138 (2012). [DOI] [PMC free article] [PubMed] [Google Scholar]
- 10.Hiruma, H. et al. Sickle cell rheology is determined by polymer fraction–not cell morphology. Am. J. Hematol.48, 19–28 (1995). [DOI] [PubMed] [Google Scholar]
- 11.Clark, M. R., Mohandas, N. & Shohet, S. B. Hydration of sickle cells using the sodium ionophore Monensin. A model for therapy. J. Clin. Invest.70, 1074–1080 (1982). [DOI] [PMC free article] [PubMed] [Google Scholar]
- 12.Parrow, N. L. et al. Measuring deformability and red cell heterogeneity in blood by ektacytometry. J. Vis. Exp.10.3791/56910 (2018). [DOI] [PMC free article] [PubMed] [Google Scholar]
- 13.Rab, M. A. E. et al. Methodological aspects of the oxygenscan in sickle cell disease: A need for standardization. Am. J. Hematol.95, E5–E8 (2020). [DOI] [PMC free article] [PubMed] [Google Scholar]
- 14.Rab, M. A. E. et al. Oxygen gradient ektacytometry-derived biomarkers are associated with vaso-occlusive crises and correlate with treatment response in sickle cell disease. Am. J. Hematol.96, E29–E32 (2021). [DOI] [PMC free article] [PubMed] [Google Scholar]
- 15.Matthews, K., Lamoureux, E. S., Myrand-Lapierre, M.-E., Duffy, S. P. & Ma, H. Technologies for measuring red blood cell deformability. Lab Chip22, 1254–1274 (2022). [DOI] [PubMed] [Google Scholar]
- 16.Fischer, T. M., Stöhr-Liesen, M. & Schmid-Schönbein, H. The red cell as a fluid droplet: Tank tread-like motion of the human erythrocyte membrane in shear flow. Science202, 894–896 (1978). [DOI] [PubMed] [Google Scholar]
- 17.Viallat, A. & Abkarian, M. Red blood cell: From its mechanics to its motion in shear flow. Int. J. Lab. Hematol.36, 237–243 (2014). [DOI] [PubMed] [Google Scholar]
- 18.Peng, Z., Salehyar, S. & Zhu, Q. Stability of the tank treading modes of erythrocytes and its dependence on cytoskeleton reference states. J. Fluid Mech.771, 449–467 (2015). [Google Scholar]
- 19.Sinha, K. & Graham, M. D. Dynamics of a single red blood cell in simple shear flow. Phys. Rev. E Stat. Nonlinear, Soft Matter Phys.92, 042710 (2015). [DOI] [PubMed] [Google Scholar]
- 20.Iss, C. et al. Self-organization of red blood cell suspensions under confined 2D flows. Soft Matter15, 2971–2980 (2019). [DOI] [PubMed] [Google Scholar]
- 21.Mendez, S. & Abkarian, M. In-plane elasticity controls the full dynamics of red blood cells in shear flow. Phys. Rev. Fluids3, 101101 (2018). [Google Scholar]
- 22.Cordasco, D. & Bagchi, P. Orbital drift of capsules and red blood cells in shear flow. Phys. Fluids25, 091902 (2013). [Google Scholar]
- 23.Skotheim, J. M. & Secomb, T. W. Red blood cells and other nonspherical capsules in shear flow: Oscillatory dynamics and the tank-treading-to-tumbling transition. Phys. Rev. Lett.98, 078301 (2007). [DOI] [PubMed] [Google Scholar]
- 24.Fedosov, D. A., Peltomäki, M. & Gompper, G. Deformation and dynamics of red blood cells in flow through cylindrical microchannels. Soft Matter10, 4258–4267 (2014). [DOI] [PubMed] [Google Scholar]
- 25.Dupire, J., Abkarian, M. & Viallat, A. A simple model to understand the effect of membrane shear elasticity and stress-free shape on the motion of red blood cells in shear flow. Soft Matter11, 8372–8382 (2015). [DOI] [PubMed] [Google Scholar]
- 26.Atwell, S., Badens, C., Charrier, A., Helfer, E. & Viallat, A. Dynamics of individual red blood cells under shear flow: A way to discriminate deformability alterations. Front. Physiol.10.3389/fphys.2021.775584 (2022). [DOI] [PMC free article] [PubMed] [Google Scholar]
- 27.Abkarian, M., Faivre, M. & Viallat, A. Swinging of red blood cells under shear flow. Phys. Rev. Lett.98, 188302 (2007). [DOI] [PubMed] [Google Scholar]
- 28.Dupire, J., Socol, M. & Viallat, A. Full dynamics of a red blood cell in shear flow. Proc. Natl. Acad. Sci. U. S. A.109, 20808–20813 (2012). [DOI] [PMC free article] [PubMed] [Google Scholar]
- 29.Boghosian, M. E., Hammes, M. S., Cassel, K. W., Akherat, S. M. J. & Coe, F. Restoration of wall shear stress in the cephalic vein during extreme hemodynamics. J. Med. Eng. Technol.42, 617–627 (2018). [DOI] [PMC free article] [PubMed] [Google Scholar]
- 30.Ballas, S. & Smith, E. Red blood cell changes during the evolution of the sickle cell painful crisis. Blood79, 2154–2163 (1992). [PubMed] [Google Scholar]
- 31.Novelli, E. M. & Gladwin, M. T. Crises in sickle cell disease. Chest149, 1082–1093 (2016). [DOI] [PMC free article] [PubMed] [Google Scholar]
- 32.Platt, O. S. et al. Pain in sickle cell disease. Rates and risk factors. N. Engl. J. Med.325, 11–16 (1991). [DOI] [PubMed] [Google Scholar]
- 33.Rees, D. C., Brousse, V. A. M. & Brewin, J. N. Determinants of severity in sickle cell disease. Blood Rev.56, 100983 (2022). [DOI] [PubMed] [Google Scholar]
- 34.Brousse, V. et al. Brain injury pathophysiology study by a multimodal approach in children with sickle cell anemia with no intra or extra cranial arteriopathy. Haematologica107, 958–965 (2022). [DOI] [PMC free article] [PubMed] [Google Scholar]
- 35.Di Liberto, G. et al. Dense red blood cell and oxygen desaturation in sickle-cell disease. Am. J. Hematol.91, 1008–1013 (2016). [DOI] [PubMed] [Google Scholar]
- 36.Bartolucci, P. et al. Erythrocyte density in sickle cell syndromes is associated with specific clinical manifestations and hemolysis. Blood120, 3136–3141 (2012). [DOI] [PubMed] [Google Scholar]
- 37.Feugray, G. et al. Lactate dehydrogenase and hemolysis index to predict vaso-occlusive crisis in sickle cell disease. Sci. Rep.13, 21198 (2023). [DOI] [PMC free article] [PubMed] [Google Scholar]
- 38.Arlet, J. B., Herquelot, E., Lamarsalle, L., Raguideau, F. & Bartolucci, P. Impact of hospitalized vaso-occlusive crises in the previous calendar year on mortality and complications in adults with sickle cell disease: A French population-based study. Lancet Reg. Heal. - Eur.40, 100901 (2024). [DOI] [PMC free article] [PubMed] [Google Scholar]
- 39.Brousse, V. et al. Severity and burden of sickle cell disease in France: A nationwide real-world study. Haematologica108, 2476–2486 (2023). [DOI] [PMC free article] [PubMed] [Google Scholar]
- 40.Steinberg, M. H. et al. Fetal hemoglobin in sickle cell anemia: Determinants of response to hydroxyurea. Blood89, 1078–1088 (1997). [PubMed] [Google Scholar]
- 41.Rakotoson, M. G. et al. Biological parameters predictive of percent dense red blood cell decrease under hydroxyurea. Orphanet J. Rare Dis.10, 57 (2015). [DOI] [PMC free article] [PubMed] [Google Scholar]
- 42.Brugnara, C. Sickle cell dehydration: Pathophysiology and therapeutic applications. Clin. Hemorheol. Microcirc.68, 187–204 (2018). [DOI] [PubMed] [Google Scholar]
- 43.Brousse, V. et al. Prognostic factors of disease severity in infants with sickle cell anemia: A comprehensive longitudinal cohort study. Am. J. Hematol.93, 1411–1419 (2018). [DOI] [PubMed] [Google Scholar]
- 44.Agbakou, M. et al. Nationwide retrospective study of critically ill adults with sickle cell disease in France. Sci. Rep.11, 23132 (2021). [DOI] [PMC free article] [PubMed] [Google Scholar]
- 45.Wamkpah, N. et al. Renin-angiotensin blockade reduces readmission for acute chest syndrome in sickle cell disease. Cureus10.7759/cureus.23567 (2022). [DOI] [PMC free article] [PubMed] [Google Scholar]
- 46.Stankovic Stojanovic, K. et al. High lactate dehydrogenase levels at admission for painful vaso-occlusive crisis is associated with severe outcome in adult SCD patients. Clin. Biochem.45, 1578–1582 (2012). [DOI] [PubMed] [Google Scholar]
- 47.Boisson, C. et al. Shear-stress-gradient and oxygen-gradient ektacytometry in sickle cell patients at steady state and during vaso-occlusive crises. Cells11, 585 (2022). [DOI] [PMC free article] [PubMed] [Google Scholar]
- 48.Bernaudin, F. et al. Impact of early transcranial Doppler screening and intensive therapy on cerebral vasculopathy outcome in a newborn sickle cell anemia cohort. Blood117, 1130–1140 (2011). [DOI] [PubMed] [Google Scholar]
- 49.Meier, E. R., Wright, E. C. & Miller, J. L. Reticulocytosis and anemia are associated with an increased risk of death and stroke in the newborn cohort of the cooperative study of sickle cell disease. Am. J. Hematol.89, 904–906 (2014). [DOI] [PMC free article] [PubMed] [Google Scholar]
Associated Data
This section collects any data citations, data availability statements, or supplementary materials included in this article.
Supplementary Materials
Data Availability Statement
The data that support the findings of this study are not openly available due to reasons of sensitivity and are available from the corresponding author upon reasonable request.