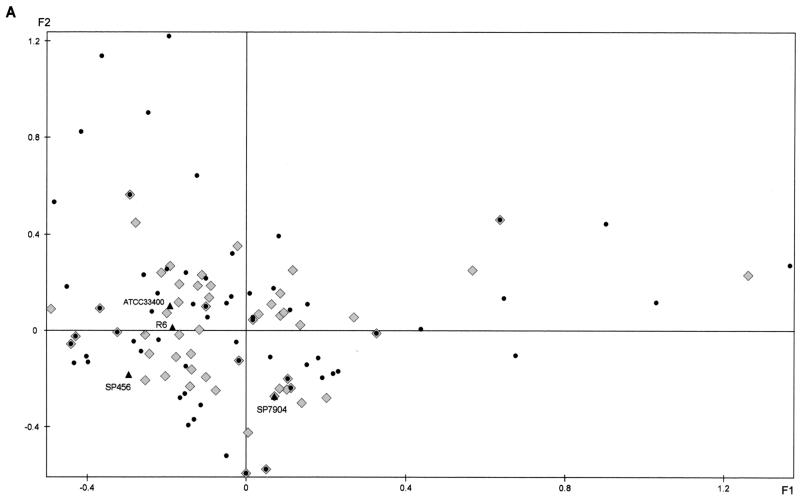
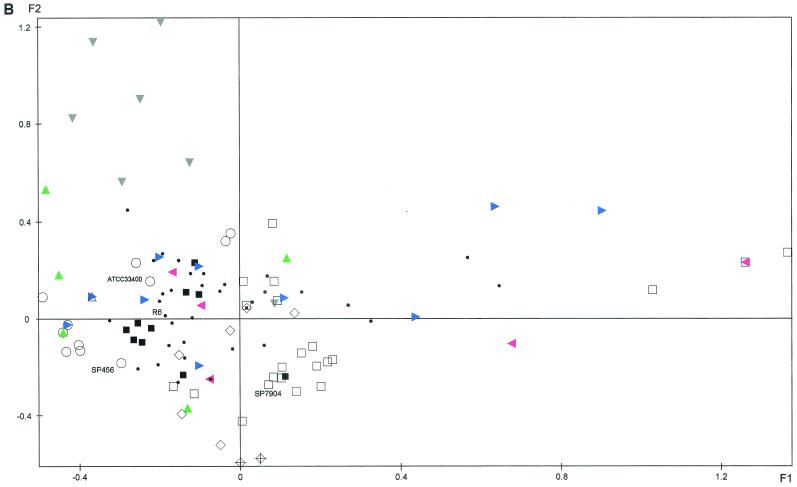
FIG. 2.
Factorial analysis of correspondence of S. pneumoniae bacteremia isolates (n = 109), CSF isolates (n = 86), and reference strains based on RFLP of rRNA genes. (A) Projection of the bacteremia isolates (•), the CSF isolates (♦), and the reference strains (▴). (B) Projection of serotype 1 (▾; grey), 6A (◂; pink), 6B (□), 9V (+), 14 (⋄), 18C (▪), 19A (▴; green), 19F (▸; blue), 23F (○) and other (•) isolates. For clarity, when several isolates are projected on the same point of the plane, only one is indicated.


