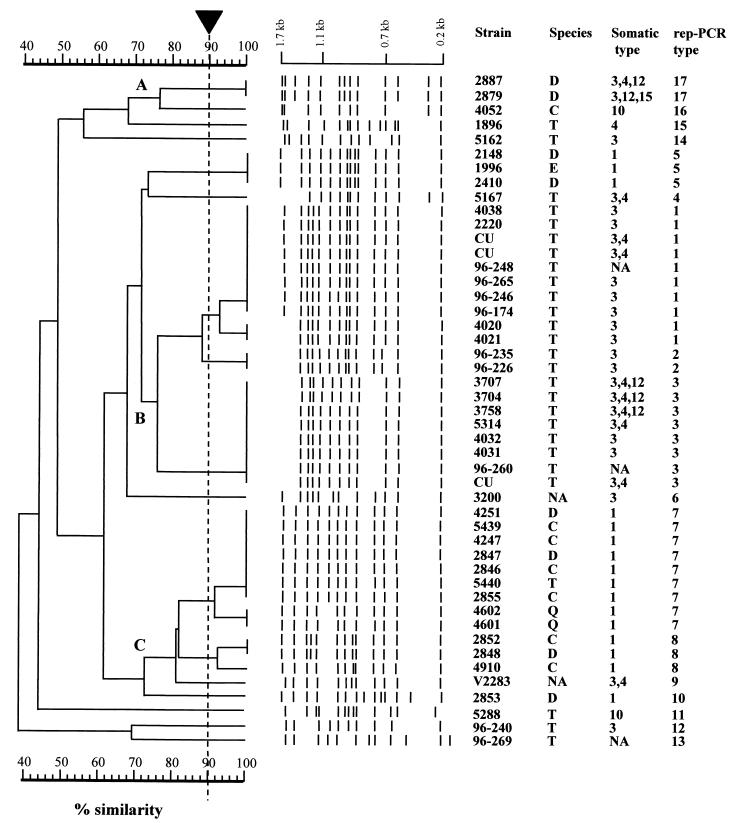
FIG. 1.
UPGMA dendrogram of genetic relatedness of 17 rep-PCR types (1 to 17) of 47 P. multocida isolates recovered from avian sources. The scale represents percent similarity generated by computer-assisted comparison of rep-PCR fingerprint profiles. The arrow indicates the cutoff value (90%) for cluster analysis. Species: D, duck; C, chicken; T, turkey; E, bald eagle; Q, quail. NA, not available; CU, Clemson University.

