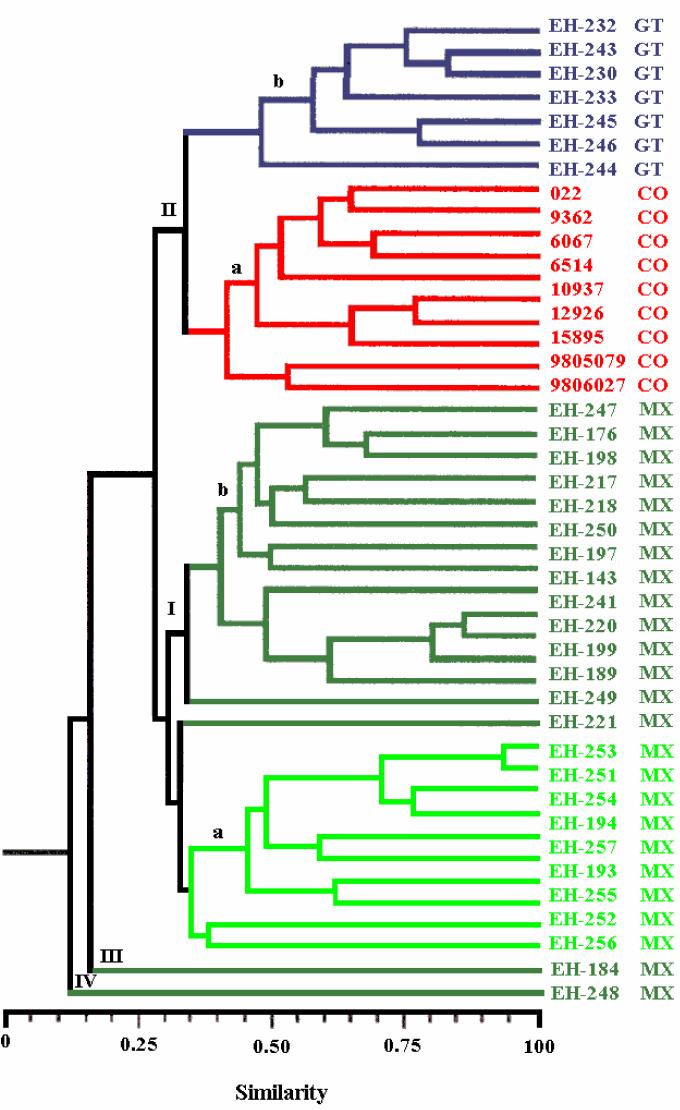
FIG. 2.
Relationship of S. schenckii isolates. The phenogram was generated from genetic similarity coefficients obtained by determination of the presence and absence of a total of 52 DNA bands from 44 isolates and is based on UPGMA. Dark green, clinical isolates from MX; light green, environmental isolates from MX.

