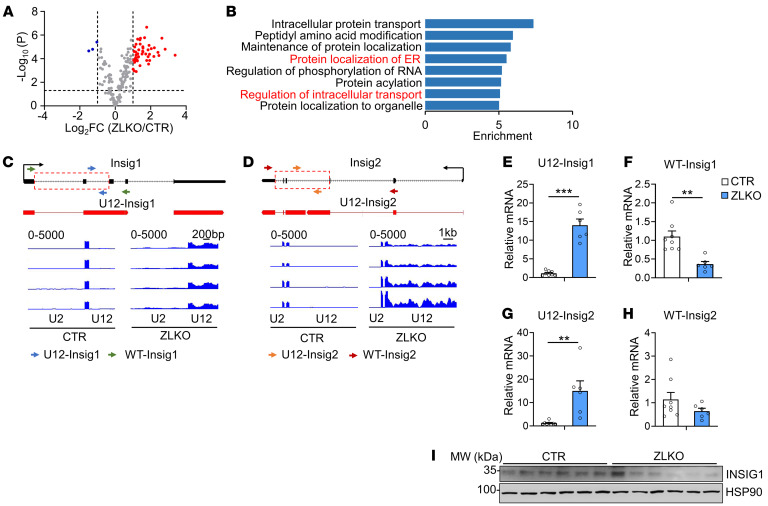
Figure 4. Disruption of minor intron splicing leads to Insig1 and Insig2 minor intron retention.
(A) Volcano plot showing the upregulated (red) and downregulated (blue) minor intron retention genes in the livers of ZLKO mice (n = 4) compared with those of CTR mice (n = 4) on chow-diet feeding. FC, fold change. (B) Gene Ontology analysis showing pathways enriched in minor intron retention genes. (C and D) Genome Browser visualization showing peaks corresponding to the U12 and U2 introns in Insig1 and Insig2 in the livers of CTR (n = 4) and ZLKO (n = 4) mice. (E–H) qPCR analysis of U12 intron expression of Insig1 and Insig2 (E and G) and mRNA level of WT Insig1 and Insig2 (F and H) in the livers of CTR (n = 8) and ZLKO (n = 6) mice. The primers used are shown in C and D. (I) Immunoblotting of liver lysates from CTR and ZLKO mice.

