
FIGURE 1.
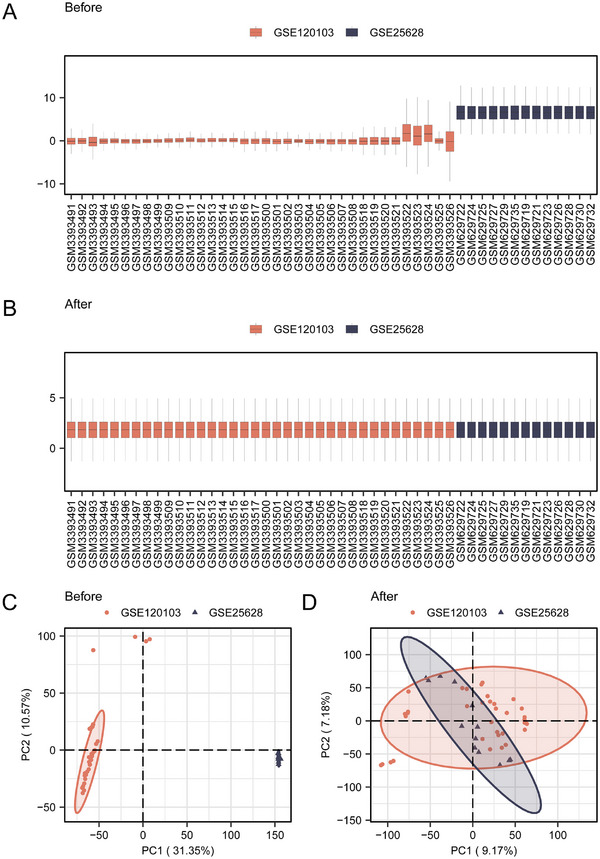
Screening of DEGs associated with EMs. (A) Boxplot of the merged dataset before dataset correction. (B) Boxplot after correction of the merged dataset. (C) PCA plot of the combined dataset before correction. (D) PCA plot after correction of the combined dataset.