

ABSTRACT
Background
Chronic low back pain is a global socioeconomic crisis, and the majority of those treated for this condition fail to reach long‐term remission. Intervertebral disc degeneration is the predominant associative factor in chronic low back pain. Degenerated discs present with mechanical instability, inflammation, and nerve sprouting. Patients treated with spinal stabilizing procedures often report pain alleviation indicating aberrant spinal mechanics, could be causative in the production of pain.
Methods
With this knowledge, a therapeutic was engineered from decellularized healthy porcine nucleus pulposus tissue mixed with type I collagen and a chemical crosslinker, genipin, to treat mechanical instability and pain.
Results
In vitro, this hydrogel, termed dNP+, was spontaneously fibrillogenic at 37°C and cytocompatible with primary human disc cells and exhibited the capacity to improve the intervertebral disc storage modulus after injury. In vivo, in a rat model of discogenic low back pain, dNP+ proved effective at restoring degenerated disc volume, decreasing axial hypersensitivity, and decreasing spontaneous pain‐like behavior when administered 9 weeks after disc degeneration was initiated. However, dNP+ did not alter nerve presence or restore disc morphology when compared to injured discs.
Conclusion
Conclusion: Altogether, the data collected in this study concluded that dNP+ was an effective treatment for pain‐like behavior in a robust animal model of chronic disc‐associated low back pain.
Keywords: decellularized tissue, disc degeneration, disc‐associated pain, genipin, low back pain
Degenerated painful discs present with mechanical instability, inflammation, and nerve sprouting, however, patients treated with spinal stabilizing procedures often report pain alleviation indicating spinal mechanics, could be causative in the production of pain. With this knowledge, a therapeutic was engineered from decellularized healthy disc tissue mixed with type I collagen, and a chemical crosslinker, genipin to treat mechanical instability and pain. Altogether, the data collected in this study concludes that dNP+ was an effective treatment for pain‐like behavior in a robust animal model of chronic disc‐associated low back pain.
1. Introduction
Low back pain (LBP) is the leading contributor to disability worldwide [1]. The majority of those who suffer an episode of LBP recover, but for some, the pain persists and becomes debilitating [2]. Chronic LBP imposes a tremendous socioeconomic burden on the world by increasing the risk of unemployment, depression, insomnia, suicide, and healthcare expenditures [3, 4, 5]. The predominant etiology for this condition is pain arising from the intervertebral disc, termed disc‐associated pain [6]. Patients suffering from disc‐associated LBP exhibit pathological changes in their discs, including hypermobility, inflammation, and innervation [7, 8, 9]. Despite the understanding of these fundamental aspects of disc‐associated pain, more than half of patients fail to achieve remission after treatment [2, 10, 11, 12, 13, 14, 15].
The intervertebral disc is a viscoelastic tissue that sits between vertebral bodies of the spine and is predominantly aneural [16]. The disc consists of an inner nucleus pulposus (NP), outer annulus fibrosus, and is flanked by two adjacent cartilaginous endplates [17]. In a healthy state, the disc provides an important role in dissipating loads [17]. Due to age, injury, environment, and/or genetics, cells of the disc become stressed, upending tissue homeostasis into catabolism [7, 18]. Disc catabolism is defined by a pro‐inflammatory milieu consisting of cytokines, chemokines, and enzymes such as tumor necrosis factor alpha (TNF‐α), interleukin beta (IL‐1β), interleukin 6 (IL‐6), C‐C motif ligand 2 (CCL2), matrix metalloproteinases (MMPs), and aggrecanases [19, 20, 21, 22]. These factors recruit and activate immune cells and break down the extracellular matrix, resulting in inflammatory persistence and biomechanical decline [23, 24]. Coinciding degeneration, a loss of neuroinhibitory proteoglycans and formation of annular fissures create a neuro‐permissive environment, allowing nerves to aberrantly penetrate the disc [25, 26]. While the presence of nerves within the degenerated disc is the basis for pain, there is considerable evidence that altered biomechanics drives nociception, poising hypermobility as the primary causative agent in disc‐associated pain [9, 27]. Historically, this notion has been supported by animal models of painful disc degeneration induced by spinal destabilization [27, 28, 29, 30, 31]. Further, patients treated with disc stabilizing treatments like surgical fusion, which rotationally and translationally lock the disc, or spinal stability exercises which impart stronger musculature control over spinal movements, often report pain remission in the short term [14, 32, 33, 34]. These data suggest targeting aberrant mechanics may be a way to treat disc‐associated pain.
Thus, the objective of this work was to develop a biomaterial capable of annealing macro‐ and microscopic defects in the degenerated disc tissue to mechanically stabilize the degenerated disc and in turn lessen disc‐associated LBP. Our lab has previously developed a novel biomaterial derived from decellularized healthy porcine NP tissue that is spontaneously fibrillogenic, cytocompatible, and neuroinhibitory [35]. We modified the constituent concentrations of this biomaterial and added a collagen crosslinker, genipin, to create a robust hydrogel capable of integrating with degenerated disc tissue. Herein, we demonstrate that this biomaterial maintains cytocompatibility and is effective at restoring disc volume and disc mechanics and alleviating axial hypersensitivity 9 weeks after injury in a rat model of disc‐associated LBP.
2. Materials and Methods
2.1. Study Overview
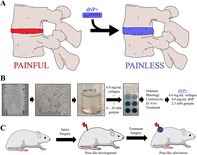
The hypothesis of this work was that a painful degenerated disc could be transitioned to a painless state using a hydrogel fabricated from decellularized tissue (Figure 1A). The success of this hypothesis hinged upon the delivery and maintenance of the hydrogel within the degenerated and painful disc. This criterion motivated the inclusion of a tissue crosslinker, genipin. The first arm of this work focused on engineering a genipin crosslinked hydrogel derived from decellularized NP tissue and collagen type I (Figure 1B). Type I collagen was selected because stable painless degenerated discs transition from predominantly type II to type I collagen to stabilize this disc [36, 37]. Porcine cervical NPs were dissected, decellularized, comminuted, digested, neutralized, and supplemented with 6 mg/mL collagen to form a dNP gel. Additionally, dNP gels were supplemented with 0–20 mM genipin to measure the variable effects of genipin crosslinking on select outcomes. These outcomes consisted of gelation kinetics, rheological properties, cytotoxicity, and ex vivo capacity to augment disc mechanics. Work done in this first arm suggested a 6.0 mg/mL dNP + 6.0 mg/mL collagen I + 2.5 mM genipin hydrogel, termed dNP+, was the best candidate for in vivo evaluation. To test the therapeutic in vivo, disc degeneration was induced in female Sprague Dawley rats and progressed for 9 weeks (Figure 1C) using our previously established model of disc‐associated pain [37]. At 9 weeks, injured animals were treated with dNP+ or 1X PBS, and pain‐like alleviation was measured over the following 6 weeks.
FIGURE 1.
Study overview. (A) The central proposal of this work was that a treatment for disc‐associated pain could be fabricated from a mixture of decellularized healthy porcine NP tissue, collagen, and genipin. This therapeutic would theoretically be tissue integrating, spontaneously fibrillogenic, cytocompatible, and biomechanically restorative, leading to pain‐like behavior remission. (B) The first arm of this work entailed testing decellularized nucleus pulposus gels supplemented with 6.0 mg/mL collagen and genipin from 0 to 20 mM. Testing of these gels (dNPs) included gelation kinetics, rheology, cytotoxicity, and ex vivo capacity to restore injured disc mechanics. (C) The outcomes of the first arm determined that the optimal formulation to test in vivo was 6.0 mg/mL dNP + 6.0 mg/mL collagen +2.5 mM genipin, referred to in this manuscript as dNP+. To test this therapeutic, disc degeneration was induced in female Sprague Dawley rats and allowed to progress for 8 weeks. At 9 weeks post‐injury, half of the injured animals were treated with dNP+ and the other half with 1X PBS. Throughout the in vivo arm, disc volume and pain‐like behavioral metrics were collected to monitor the effects of disc injury and treatment.
2.2. Whole Disc Decellularization and Preparation of Decellularized NP Gel
Whole disc decellularization was accomplished using a previously established protocol [35]. In short, cervical spines from a commercial line of Landrace/Yorkshire/Duroc young female pigs (~200 days of age) were aseptically collected and frozen (−80°C) following euthanasia at the United States Meat Animal Research Center Abattoir (Clay Center, NE, USA; USDA). After thawing, the spines were cleaned aseptically and the NP of the C2–C7 intervertebral discs was removed. NPs were decellularized using a series of detergent and buffer washes as previously published [35]. Our previous publication found that 99% of DNA was removed and 74% of sulfated glycosaminoglycans were maintained, verifying a robust yet gentle process. Briefly, whole discs were washed in water for 7 h and then decellularized using a series of mild detergents (3% (w/v) SD/0.6 mM SB‐16 in 50 mM sodium/10 mM phosphate buffer or 125 mM SB3‐10 in 50 mM sodium/10 mM phosphate buffer) and buffered wash steps as outlined previously. After final washes, discs were treated with 75 U/mL DNAse, washed in buffers, rinsed in PBS for 3 × 3 h, and finally washed in ddH20 for 3 × 15 min. After decellularization, NPs were lyophilized and stored at −80°C until use.
Lyophilized decellularized NPs were comminuted via cryogenic pulverization using a steel mortar and pestle in a liquid nitrogen bath. 20 mg/mL of comminuted dNP was digested using 1 mg/mL of pepsin (P6887, Sigma‐Aldrich) in 0.05 N HCl for 44 h at 300 rpm using a magnetic stir bar at room temperature. Following digestion, all steps for making the dNP hydrogel were performed on ice, until incubation at 37°C. dNP digest and type I collagen (Ibidi, 50201) were added to 10X PBS to reach a final concentration of 6 and 6 mg/mL, respectively. The digest was then neutralized with 5 M NaOH to achieve a pH ~7.4. Finally, genipin (TCI Chemicals, G0458‐25MG) at a stock concentration of 400 mg/mL in dimethyl sulfoxide (DMSO, Chem‐Impex International, 00635) was added to the neutralized dNP solution to yield final genipin concentrations ranging from 0 to 20 mM. The final formulation used in vivo, termed dNP+, consisted of: 1X PBS, 6 mg/mL collagen, 6 mg/mL dNP, and 2.5 mM genipin.
2.3. Gelation Kinetics
The rate at which the dNP gels achieved collagen fibrillogenesis and genipin cross‐linking was assessed using an absorbance assay. Collagen fibrillogenesis was measured using absorbance at 405 nm [35]. Genipin cross‐linking was measured using absorbance at 610 nm [38]. To measure these two absorbances longitudinally, 50 μL of dNP gel with genipin ranged from 0 to 20 mM was prepared and pipetted in duplicate into a 96‐well plate. The plate was placed into a microplate reader and preheated to 37°C, and the absorbance was read once every 2 min for 12 h at 405 and 610 nm. A total of n = 3 different preparations were evaluated.
2.4. Gel Rheological Characterization
Rheological analysis of the dNP gels was performed to evaluate how genipin affected mechanical properties using an Anton Paar MCR 302 with sand blasted plates. Briefly, dNP gels were formed by pipetting 100 μL of the gel solutions into 8‐mm diameter silicone molds (666305, Grace Bio‐Labs). The gels were sandwiched between glass slides within the molds and incubated at 37°C for 24 h to allow for complete fibrillogenesis and crosslinking. After gelation, the gels were soaked in 1X PBS for 30 min. An amplitude sweep was conducted to determine the storage and loss modulus across strains analogous to human movement [39], from 0.1% to 1.66% at an angular frequency of 5 Hz. The average storage and loss modulus from 0.137% to 0.477% strain was computed as the storage and loss modulus for each gel. Gels were fabricated and tested in duplicate, and this process was repeated three times (n = 3).
2.5. Ex Vivo Motion Segment Rheological Characterization
Rheological analysis of rat motion segments was performed to evaluate how treatment with dNP+ affects disc mechanics after injury in an ex vivo setting by testing undamaged motion segments, 6‐scrape in vitro injury motion segments, and injured + treatment motion segments. Briefly, motion segments were excised from cadavers and potted in custom 3D printed pots using Loctite 401 (Grainger). After pot fixation, motion segments were allowed to equilibrate in 1X PBS with a protease inhibitor (PI78425, Thermo Scientific) at 4°C for 30 min. To induce the 6‐scrape injury, lumbar motion segments (L3‐L4, L4‐L5 and L5‐L6, L6‐S1) were punctured bilaterally with a strong point dissecting needle (Roboz, RS‐6066) with an O.D. of 0.5 mm set to a length of 2.75 mm and swept back and forth along a 90° arc six times in the transverse plane. A treatment of 2.5 μL was delivered to the motion segments using a 27‐gauge needle, allowed to incubate overnight at 37°C, and again placed in 1X PBS with a protease inhibitor at 4°C for 30 min. Undamaged controls were included at all time points. To analyze, motion segments were brought to room temperature and attached to the rheometer base plate and probe using labeling tape. An amplitude sweep was then conducted to determine the storage and loss modulus across a strain range from 0.1% to 1.66% at an angular frequency of 5 Hz. The average storage and loss modulus from 0.137% to 0.477% strain was computed as the storage and loss modulus for each motion segment. All data were normalized to pre‐injury baselines so that motion segments from L4 to S1 could be pooled without dramatically increasing the variability.
2.6. Cytotoxic Assessment of dNP+
To evaluate the cytotoxicity of dNP+ in vitro, human NP cells were cultured on top of dNP+ gels. This culture method allowed for cells to be in contact with the gel and any free genipin. In brief, passage 3 human NP cells (4800, ScienCell) were cultured in a T75 flask (CLS430641U, Sigma Aldrich) coated with 15 μg of poly‐L‐lysine (0413, ScienCell) using Complete Nucleus Pulposus Cell Media (4801, ScienCell) till confluent. 48‐well plates were prepared for treatment culture by coating with either nothing (PS) or with 10 μL of 6 mg/mL collagen gel (control), 6 mg/mL collagen + 6 mg/mL dNP gel (no genipin), or 6 mg/mL collagen + 6 mg/mL dNP + 2.5 mM genipin gel (dNP+). The coatings were gelled for 8 h at 37°C in a humidified incubator and then equilibrated for 12 h in 1X PBS. NP cells were plated on top of the treatments at a density of 7500 cells/cm2 and cultured for 48 h in phenol‐free Complete Nucleus Pulposus Cell Media (4801‐prf, ScienCell). After 48 h, each well was washed three times with 1X PBS and incubated with 200 μL of 2 μM calcein AM (Thermo Fisher C3100MP) and 4 μM Eth‐1 (ThermoFisher E1169) in 1X PBS for 30 min. The cells were then washed three times with 1X PBS and imaged on a Cytation 1 (BioTek) at 10X using GFP and RFP fluorescent cubes. Four images were taken from each well, deconvoluted, and analyzed using Gen 5 software to evaluate cell number and size in each channel. Viability was calculated using the following calculation: (#GFP objects/(#GFP objects + #RFP objects) × 100).
2.7. Surgical Procedures
Our lab has previously described an animal model of disc‐associated LBP in rats that exhibits disc degeneration, disc innervation, and pain‐like behavior under mechanical perturbation, thus providing an ideal model for testing [37]. Therefore, this model was used for this study. All animal studies herein were conducted under an approved Institute for Animal Care and Use (IACUC) protocol at the University of Nebraska‐Lincoln. Thirty‐six female, 15‐week‐old, Sprague Dawley rats were purchased from Envigo and housed with a 12‐h light/dark cycle and ad libitum access to food and water. On the day of surgery, the animals were split into three treatment groups of equal size (n = 12): sham, 1X PBS, and dNP+ (Figure 2). Animal number per group was calculated based on the number of animals required to detect a 50% difference in grip strength at 0.8 power with α = 0.05. After surgery, all animals were weighed and assessed on a weekly basis for overall health. After the initial surgery, one sham animal had to be euthanized prematurely due to weight loss exceeding 20%. After treatment surgery, one dNP+ animal was excluded due to incorrect treatment formulation and one sham animal was excluded due to weight loss exceeding 20%. All animal procedures and assays were in accordance with the National Institute of Health guidelines following PHS Policy on Humane Care and Use of Laboratory Animals and according to a protocol approved by the Institutional Animal Care and Use Committee and the University of Nebraska–Lincoln.
FIGURE 2.
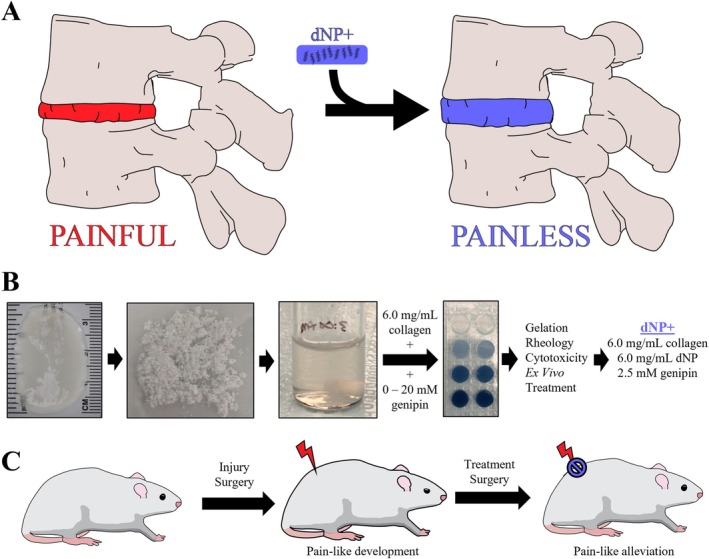
Animal study overview. (A) Timeline of the in vivo assessment of dNP+. Animals were acclimated for 3 weeks before a week of baseline behavior and μCT measurements. Injury surgery was performed on week 0 and disc degeneration was allowed to progress for 8 weeks before treatment surgery on week 9. Following treatment surgery, behavior and μCT measurements were collected for 6 weeks. (B) For this study, 36, 19‐week‐old, female Sprague Dawley rats were split into three groups: Sham, PBS, and dNP+. One sham animal was terminated due to surgical complications and one dNP+ animal was excluded due to incorrect treatment injection. Final animal numbers are shown in bold in parenthesis. (C) Three assays were employed to measure the development and alleviated of pain‐like behavior during the study. The open field test measured spontaneous pain‐like behavior and grip strength and pressure algometry measured evoked pain‐like behavior. (D) Graphical depiction of the injury surgery. The L5‐L6 IVD was approached ventrally and injured using a microdissecting needle. (E) During treatment surgery, the L5‐L6 disc was visualized in all animal groups. The disc can be seen at the tip of the black arrowhead. (F) Animals in the PBS group were injected with 1X PBS and animals in the dNP+ group were injected with dNP+.
Following baseline behavior collection, rats aged 19 weeks were anesthetized, and the lumbar spine was exposed ventrally by dissecting through the abdominal cavity and retroperitoneum. The iliac crest was used as a landmark to reliably dissect down to the L5‐L6 disc. For sham animals, the L5‐L6 was visualized only, and the surgical site was closed as outlined below. For PBS and dNP+ animals, the L5‐L6 lumbar disc was punctured bilaterally with a strong point dissecting needle (Roboz, RS‐6066) with an O.D. of 0.5 mm set to a length of 2.75 mm. While in the disc, the needle was swept back and forth along a 90° arc six times in the transverse plane. A simple continuous and subcutaneous suture pattern was used to close the abdominal wall and the skin, respectively. Buprenorphine SR (0.75 mg/kg) was administered once post‐operatively for pain, and animals were rested for 2 weeks following surgery to enable healing. Animals were monitored every 12 h for 72 h post‐operatively for activity level, porphyrin presence, gait disruption, and wound health. All animals displayed mild pica behavior after surgery, which is commonly seen in rodents [40], but this behavior resolved within 72 h.
On the day of surgery, rats were anesthetized, and the L5‐L6 disc was approached using the same method as the injury surgery. For sham animals, the L5‐L6 was visualized only, and the surgical site was closed in the same manner as treated animals. For PBS and dNP+ animals, the L5‐L6 lumbar disc was injected through the midline using a 30‐gauge needle (BD, 305106) with a rubber stopper (WidgetCo, 7‐R0000000‐EPDM‐RS) fixed at 2 mm attached to a 10 μL gastight microsyringe (Hamilton, 80001). The needle length was predetermined based on μCT data to increase the probability that the therapeutic was delivered to the NP space. PBS animals were injected with 2.5 μL of sterile 1X PBS, and dNP+ animals were injected with 2.5 μL of dNP+. The injection site was sealed with Vetbond (3 M, 1469c). The abdominal wall and skin were closed, and animals were administered Buprenorphine SR as noted above and rested for 2 weeks. Animals were monitored every 12 h for 72 h post‐operatively for activity level, porphyrin presence, gait disruption, and wound health. All animals displayed mild pica behavior after surgery, but this behavior resolved within 72 h.
2.8. Disc Volume Calculation
The L5‐L6 disc volume was quantified using the Quantum GX2 μCT Imaging System and Analyze 13.0 (Analyze Direct). In short, the rat lumbar spine was radiographed by placing anesthetized animals in the supine position and scanning for 2 min with 90 kV power, 88 μA tube current, 72 mm FOV, 144 μm voxel size, and a Cu 0.06 + Al 0.05 x‐ray filter. VOX files were then removed from the μCT computer and analyzed in Analyze 13.0 to determine volume as previously published from our lab by a blinded observer [41].
2.9. Behavioral Assessments
For all behavioral tests, animals were acclimated prior to the study commencement to experimenters daily for a minimum of 5 min per day over eight days. Following experimenter acclimation, animals were acclimated to the assay apparatuses for at least 2 h prior to any data collection. All assays were performed under red light to minimize animal stress. Two sets of baseline behavior measurements were collected and averaged together. Animals pain‐like development was then assessed every 2 weeks using two evoked pain‐like behavior assays: grip strength and pressure algometry, and one spontaneous pain‐like behavior assay: the open field test. Experimenters were blinded to animal treatment, and all animals were randomly assigned to treatment groups.
2.9.1. Grip Strength Axial Hypersensitivity
Hypersensitivity to axial strain was quantified using a grip strength apparatus (Columbus Instruments, 1027SR). Animals were picked up by grasping the hind quarter and then allowed to grip a metal wire mesh attached to the grip strength force sensor. The experimenter's grip was then transitioned to the base of the tail, and the animal was gently pulled backward until it released the metal wire mesh. This process was repeated three times, and the average max force (N) was used as the grip strength. All withdraw grip strength thresholds were normalized to baseline values to reduce variability.
2.9.2. Pressure Algometry Deep Tissue Hypersensitivity
Pressure hypersensitivity around the L5‐L6 motion segment was measured using an electronic von Frey aesthesiometer (IITC, 2391) with a blunt tip. All animals were allowed to acclimate to the testing room for at least 5 min prior to testing. Each animal was sequentially covered inside a clean cotton t‐shirt. The animal was then loosely constrained by one experimenter while another experimenter applied the blunt probe to the dorsal L5‐L6 skin and slowly increased the pressure until the animal exhibited a nocifensive response. Positive responses included rolling, rapid movement, and vocalization. Two measurements were collected for each animal and the average was recorded. All animal thresholds were normalized to baseline values to reduce variability.
2.9.3. Open Field Test
Movement‐evoked pain‐like behavior was evaluated using the open field test with custom built acrylic 2′ × 2′ × 2′ black plexiglass, opaque arenas. All animals were allowed to acclimate to the testing room for 15 min prior to testing. Animals were individually placed in arenas illuminated by overhead red lighting and allowed to explore for 30 min while recorded by an overhead low‐light camera (ALPCAM). The middle 20 min of each video was analyzed using EthoVision (Noldus) for total distance traveled, time spent rearing unsupported, time spent rearing supported, time spent grooming, max velocity, average turn angle, and max turn angle.
2.10. Diclofenac Treatment
Diclofenac was administered to all animals at 15 weeks to verify the predictive validity of the animal model. Diclofenac was selected because it can be used to treat acute LBP in humans [42, 43]. To accomplish this, diclofenac (MilliporeSigma, 1188800‐200MG) was dissolved in 1X PBS at 5 mg/mL and administered intraperitoneally at 10 mg/kg by an unblinded observer that did not participate in behavioral assessment. Animals were allowed to absorb the diclofenac for 30 min before grip strength evaluation. No signs of toxicity were observed in any animals.
2.11. Motion Segment Processing and Tissue Processing
2.11.1. Motion Segment Processing
Following the end of the study, animals were humanely euthanized via CO2 inhalation followed by bilateral pneumothorax puncture. The L5‐L6 motion segments were isolated from each animal and cleaned before fixation in 3 mL of 4% paraformaldehyde (PFA) (Sigma Aldrich, 441244‐1KG) for 24 h at room temperature with constant agitation (180 rpm) on an orbital shaker. Following fixation, motion segments were washed 3 × 15 min with 1X PBS and then placed in 3 mL of Immuonocal (Fisher Scientific, NC9044643) for decalcification. Decalcification was carried out for 18 h at room temperature accompanied by constant agitation (180 rpm) on an orbital shaker. Motion segments were again washed 3 × 15 min with 1X PBS and soaked in 30% wt/v sucrose prepared in 1X PBS for 24 h at 4°C. Lastly, motion segments were cryoembedded in Optimal Cutting Temperature Compound (Scigen 4586), frozen at −80°C, and sectioned in the sagittal plane in 15 and 40 μm sections. Due to incorrect identification of motion segment levels, one PBS animal and two dNP+ animals had to be excluded from post‐processing analysis. Thus, the following assays used the following animal numbers: sham = 10, PBS = 11, & dNP+ = 9.
2.11.2. Histological Processing
Hematoxylin and eosin (H&E) staining is a standard method used to assess disc histology [37, 44]. First, three 15 μm thick L5‐L6 motion segment sections from each animal were post‐fixed in 4% PFA for 10 min followed by 3 × 5 min washes in 1X PBS and 1 × 1 min wash in MQH2O. Slides were stained for 3 min in Ehrlich's Hematoxylin (EMS, 26753‐01) and washed 4 × 30 s with MQH2O. Slides were then dipped in an acid alcohol solution 12 times. Next, slides were blued in a sodium acetate solution for 2 min. Slides were washed again for 3 × 1 min in MQH2O and counterstained with eosin (EMS, 26762‐02) for 20 s and dehydrated in ethanol. This dehydration process included 2 s in 70% ethanol, 2 × 2 min in 95% ethanol, and 2 × 2 min in 100% ethanol. Lastly, in the fume hood, slides were dehydrated with xylene for 1 min (Sigma Aldrich, 214736) and mounted with Permount mounting solution (Fisher Scientific, SP15‐100). H&E images were collected using brightfield on a Zeiss Axioscan 7 slide scanner at a 5× objective (Carl Zeiss Microscopy). A standardized histopathology scoring system previously utilized was implemented to score all H&E images by a group of three blinded observers [37, 44]. The scoring system evaluated each category on a 0–2 scale with a lower score indicative of a healthy phenotype. The categories of NP cell morphology and endplate were omitted due to difficulties in section clarity in grading these categories.
2.11.3. Immunohistochemistry
Three 40 μm thick sections of the L5‐L6 motion segments from each animal were post‐fixed in 4% PFA for 15 min, followed by 2 × 5 min washes in 1X PBS and one 5 min wash in 1X PBST. Slides were then blocked for 1 h in blocking buffer composed of 1X PBST, 3% goat serum (Sigma‐Aldrich, G9023), and 0.01% Tween‐20 (Fisher Scientific, BP337‐100). After blocking, slides were incubated for 16 h with 1:100 mouse‐derived anti‐calcitonin gene‐related peptide (CGRP) (abcam, Ab81887) and 1:100 rabbit‐derived anti‐protein gene product 9.5 (PGP9.5) (abcam, Ab108896) in blocking buffer. Then, slides were washed 3 × 15 min with PBST and incubated for 2 h with 1:500 goat‐derived anti‐mouse AF488 (abcam, Ab150117) and 1:500 goat‐derived anti‐rabbit AF555 (abcam, Ab150086) in blocking buffer. Sections were again washed 3 × 15 min with PBST and incubated with 1:1000 4′,6‐diamidino‐2‐phenylindole (DAPI, ThermoFisher, D1306) in 1X PBS for 10 min. Finally, slides were mounted using Prolong Gold (ThermoFisher, P36930). Slides were imaged on a Zeiss Confocal Microscope LSM 800 (Carl Zeiss Microscopy) with a 10X objective. Whole motion segments were imaged using the tiling feature and z‐stacks to capture the entire section thickness. Brightfield images were captured along with fluorescence with the following emission/excitations: 353/465 (DAPI), 493/517 (AF488), and 553/568 (AF555).
2.12. Image Analysis
All immunohistochemistry (IHC) images were imported into ZENBlue (Carl Zeiss Microscopy), and Z‐stack max projections were created and saved as .czi files. Files were then imported into QuPath‐0.4.3 (Pete Bankhead) for analysis and region drawing. The wand tool and brush tool were used to draw annotations on each section to represent the dorsal annulus fibrosus (AF), NP, inner 2/3 of the ventral AF, outer 1/3 of the ventral AF, and granulation tissue. After the annotations were drawn, the “Pixel Classifier” tool was used to threshold PGP9.5 and CGRP positive staining in each region. The total area of positive staining in each region was then normalized to the total area of that region to obtain a percentage of positivity for each region. To identify cell nuclei using positive DAPI staining, the “Cell Detection” tool was used with a cell background radius = 8 μm and threshold = 25. The number of cells in each region was then normalized to the area of each region for analysis.
2.13. Statistical Analysis
All data are presented as mean ± standard deviation except for behavioral data, which are presented as the mean ± 95% CI. Data were analyzed using GraphPad Prism 10. Normality was assessed using the Shapiro–Wilk test, and subsequent analysis was performed. Cytotoxicity, cell area, and cell count were analyzed using a one‐way ANOVA with Tukey's post hoc test. Behavioral and disc volume data were analyzed using a repeated measures two‐way ANOVA with Dunnett's post hoc test. Motion segment rheology was evaluated using Student's t‐test. H&E scoring, nerve IHC, and cellularity IHC were analyzed using the Kruskal–Wallis test with Dunn's post hoc test. Correlations were calculated using the Pearson correlation coefficient. Results were considered statistically different when p < 0.05.
3. Results
3.1. dNP Hydrogels with and without Genepin Spontaneously Gel and Crosslink In Vitro
dNP gels completed collagen fibrillogenesis in under 15 min (Figure S1A,B). Crosslinking mediated by genipin took considerably longer than collagen fibrillogenesis, with most formulations hitting 75% max 610 nm absorbance by 4 h (Figure S1C,D). All gels were homogenous in appearance and did not desiccate during the 12‐h collection window (Figure S1E). These data showed that genipin hydrogels completed collagen fibrillogenesis in under 15 min and that the majority of genipin crosslinking activity completed in 4 h in all formulations.
3.2. Genipin Increases dNP Rheological Properties
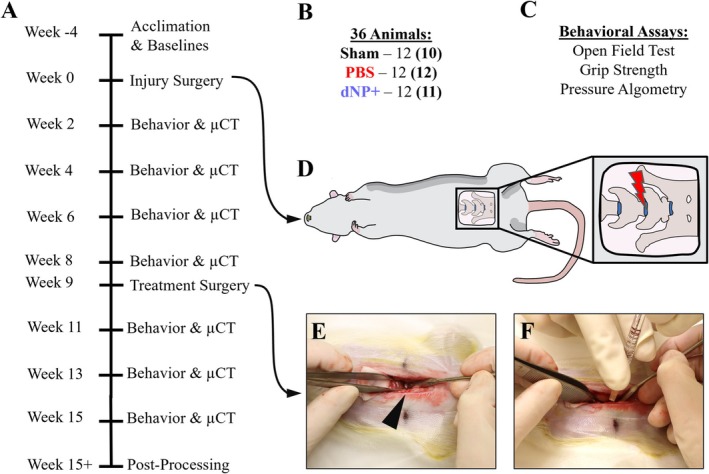
Next, each dNP formulation was measured using a rheometer for storage and loss moduli (Figure 3A). The average storage and loss modulus for 0 mM genipin gels were 709.81 ± 44.0 Pa and 118.19 ± 8.68 Pa, respectively (Figure 3B,C). The addition of genipin markedly increased storage and loss moduli, with 20 mM genipin increasing the storage modulus more than 10‐fold (11 271 ± 3248.0 Pa) compared to 0 mM gels. The average storage and loss modulus for the 2.5 mM genipin dNP gel were 2244.6 ± 208.60 Pa and 210 ± 30.976 Pa, respectively. Interestingly, the dNP hydrogels exhibited increasing variability at genipin concentrations of ≥ 5 mM. Overall, these data confirmed that genipin increased dNP mechanical properties and that 2.5 mM genipin was the highest concentration usable to maintain replicable properties.
FIGURE 3.
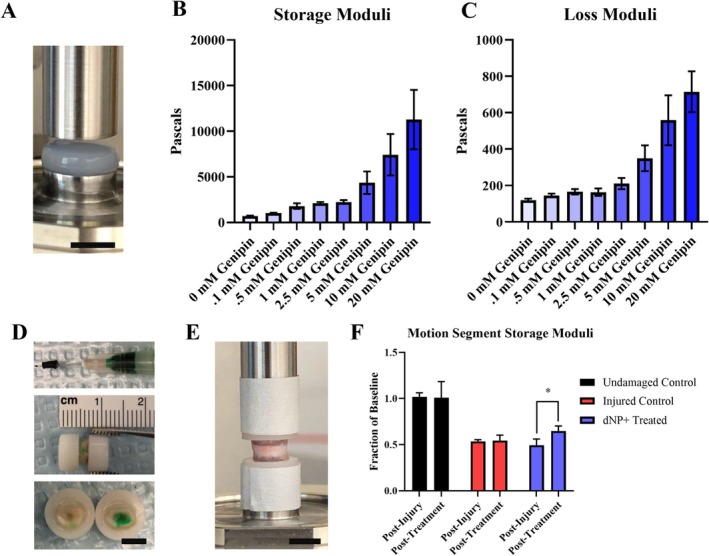
Genipin increases dNP rheological properties and dNP+ increases injured motion segment rheological properties. (A) Image of a dNP hydrogel on the rheometer. Scale bar = 4 mm. (B) Storage moduli of the dNP with various concentrations of genipin. These values represent the elastic resistance to torsional strain. The variability increased dramatically with genipin concentrations greater than 5 mM. (C) Loss moduli of the dNP with various concentrations of genipin. These values represent the viscous resistance to torsional strain. Like the storage moduli, variability increased dramatically when genipin concentrations exceeded 5 mM. (D) Overview of the injection process. In the top image, the 30‐gauge needle is shown with a rubber stopper set at 2 mm from the needle tip. The rubber stopper was fixed to the needle to make injection into the NP space easier. The middle image shows a potted motion segment injected with dNP gel dyed green. Evidence of injection can be seen by the faint green dye on the surface of the annulus fibrosus. In the bottom image, an injected motion segment was transected to display the presence of dyed dNP hydrogel injected in the disc. (E) An image of a potted motion segment fixed to the rheometer. (F) Motion segment storage moduli from undamaged, injured, and dNP+ treated motion segments. The average storage modulus of undamaged control motion segments did not change over the course of the experiment. Injury decreased the average storage modulus by 50%. Treatment with dNP+ significantly rescued the storage modulus by 15% compared to post‐injury. Data are shown as mean with SD (n = 3 per group). * = p < 0.05.
3.3. dNP+ Increases Ex Vivo Injured Motion Segment Rheological Properties
Two additional necessities for dNP+ were injectability and capacity to alter disc mechanics. These two aspects were tested ex vivo using motion segments excised from female Sprague Dawley rat cadavers. The injection process is overviewed on a potted motion segment in Figure 3D. Injury decreased the storage modulus of motion segments by around 50% compared to undamaged controls. Treatment with dNP+ significantly restored the modulus to 65% of undamaged controls (p < 0.05) (Figure 3F). These data confirmed dNP+ alone could increase disc mechanical properties after injury.
3.4. dNP+ Is Cytocompatible With Human NP Cells
To understand if the dNP+ hydrogel was cytotoxic, human NP cells were cultured on top of dNP+ for 48 h and viability was determined. Polystyrene, collagen, collagen + dNP, and dNP+ substrates all exhibited minimal cell death as noted by the absence of Eth‐1 fluorescence (Figure 4A–D). When quantified, the viability for polystyrene, collagen, collagen + dNP, and dNP+ treatments was 96.3% ± 1.9%, 96.5% ± 1.6%, 96.1% ± 0.9%, and 94.7% ± 5.6%, respectively (Figure 4E). Cell size was also quantified to assess how each substrate impacted cellular morphology. Cells grown on collagen + dNP adopted a significantly smaller cell size than cells grown on polystyrene (Figure 4C,F, p < 0.05). Cells grown on the dNP+ exhibited a more elongated morphology (Figure 4D,F). Analysis of the cell counts indicated that dNP+ proliferation was 76% of the collagen control and it did not significantly decrease cellular proliferation compared to collagen + dNP, although there was a trend toward significance (p < 0.052, Figure 4G). These results demonstrated that dNP+ is not cytotoxic to human NP cells.
FIGURE 4.
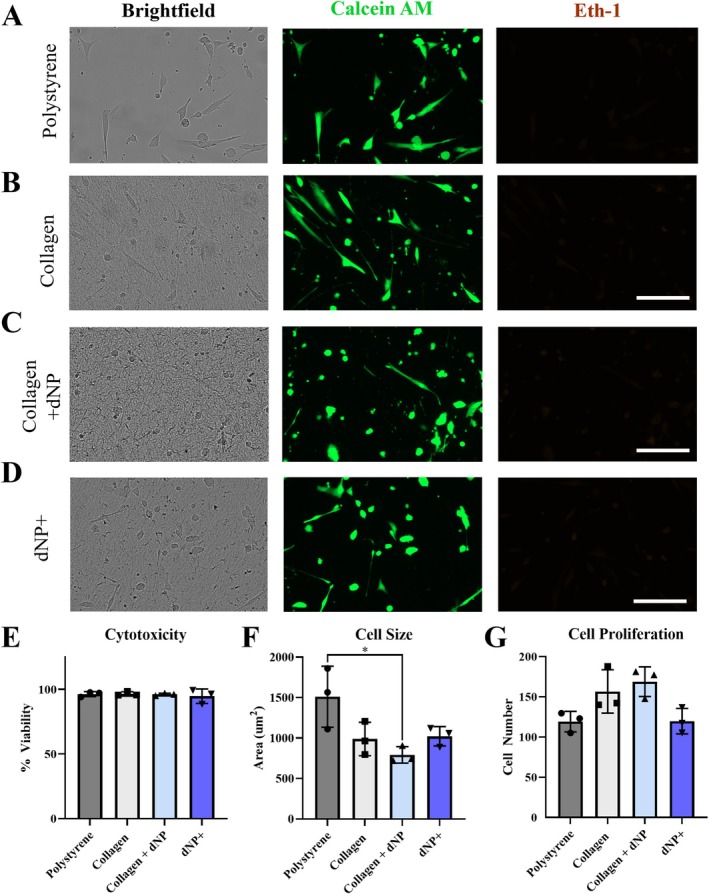
dNP+ is not cytotoxic. Representative images from the NP cell viability experiments (A–D). NP cells exhibited a more elongated morphology on polystyrene compared to collagen, collagen + dNP, and dNP+ substrates. (E) Quantification of treatment cytotoxicity. All treatments exhibited minimal cytotoxicity, with the lowest average viability occurring in the dNP+ treatment at 94.75%. (F) Quantification of cell size. Cells plated on polystyrene had a significantly larger average area than those plated on collagen + dNP. (G) Quantification of total cell proliferation over the 48 h of culture. No significant differences were detected between any treatment group. The average dNP+ treatment cell count was 66% that of collagen + dNP, but this difference narrowly missed significance (p < 0.052). Data are shown as mean with SD. Experiments consisted of three unique donors plated in triplicate (n = 3). Eth‐1 images brightness‐contrast enhanced for viewing. * = p < 0.05.
3.5. dNP+ Restores Disc Volume In Vivo
Intervertebral disc volume was quantified as a real‐time measurement of disc degeneration (Figure 5A,B). After injury from weeks 2–8, both PBS and dNP+ groups exhibited significantly decreased disc volume compared to sham animals. After treatment, dNP+ disc volume returned to baseline and was not significantly different from sham at any time point from week 11 till study conclusion. Conversely, discs injected with PBS remained at a sub‐baseline volume and were significantly different from sham and dNP+ at all time points post‐injury (p < 0.05). These data demonstrated that dNP+ treatment restored disc volume when injected 9 weeks after degeneration was initiated.
FIGURE 5.
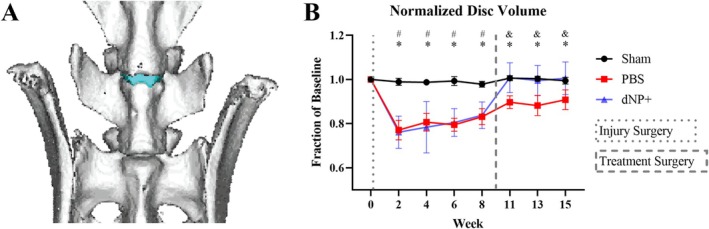
dNP+ restores disc volume. (A) 3D rendering of a rat spine from L5 to S1. The L5‐L6 IVD is colored blue. (B) L5‐L6 intervertebral disc volumes calculated from μCT data. The disc volume in both dNP+ and PBS animals significantly decreased after injury compared to sham animals. After treatment surgery, dNP+ treated animal disc volumes returned to baseline and were no longer significantly different from sham. Data are shown as mean with standard deviation (n = 11–12 per group). # = p < 0.05 sham versus dNP+. * = p < 0.05 sham versus PBS. & = p < 0.05 dNP+ versus PBS.
3.6. dNP+ and Diclofenac Alleviate Axial Hypersensitivity In Vivo
Evoked behaviors were measured during the study to assess how pain‐like behavior developed after injury and how dNP+ treatment affected pain‐like behavior. From week 6–8, PBS animals and in week 8 dNP+ animal groups exhibited significantly decreased grip strength compared to sham animals (Figure 6A, p < 0.05). After treatment surgery, this decrease in grip strength was ameliorated in animals injected with dNP+, whereas grip strength continued to decline in animals injected with 1X PBS. At weeks 13 and 15, dNP+ animals displayed significantly increased grip strengths compared to PBS animals (p < 0.05) and were not significantly different from sham (Figure 6A). These data indicate that dNP+ reduced axial hypersensitivity to sham levels.
FIGURE 6.
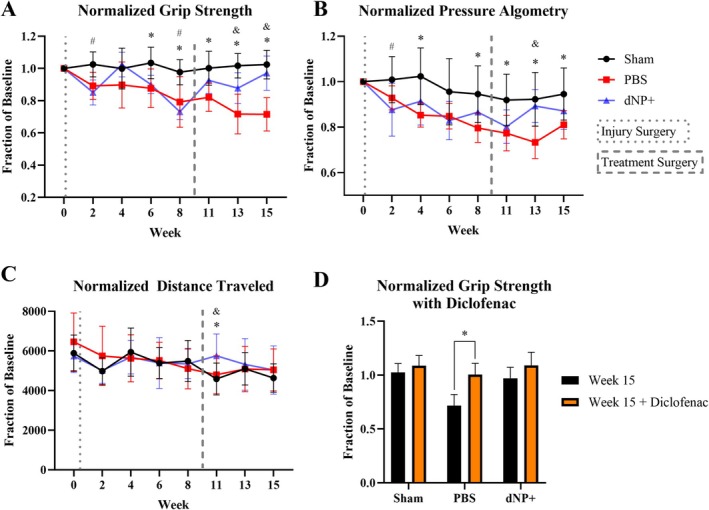
dNP+ and diclofenac alleviate axial hypersensitivity. (A) Normalized grip strength data that measured axial hypersensitivity. Both PBS and dNP+ animal groups exhibited significantly decreased grip strength in weeks 6 and 8 compared to sham animals. After treatment surgery, grip strength increased in dNP+ animals and was not significantly different from sham animals for the remainder of the study. The grip strength of PBS animals continued to decline from week 11 onward and was significantly different from sham at all time points post‐treatment surgery. PBS animals also exhibited significantly decreased grip strength compared to dNP+ treated animals at weeks 13 and 15. (B) Normalized pressure algometry that measures deep pressure hypersensitivity. PBS animals exhibited decreased pressure thresholds at weeks 4, 8, 13, and 15 compared to sham animals. Also, PBS animals exhibited lower thresholds compared to dNP+ animals at week 13. At no point did the dNP+ animal group significantly differ from sham animals. (C) Distance traveled was a measure of spontaneous pain‐like behavior. The only significant difference measured was at week 11 between dNP+ animals and sham animals. (D) 15‐week grip strength before and after treating with diclofenac. Diclofenac was effective at suppressing axial hypersensitivity as noted by the highly significant increase in animal grip strength after drug administration in PBS animals. (n = 11–12 per group). For longitudinal data, significant differences between groups were assessed using a two‐way ANOVA. Drug treatment data were analyzed using a one‐way ANOVA. # = p < 0.05 sham versus dNP+. * = p < 0.05 sham versus PBS. & = p < 0.05 dNP+ versus PBS.
The pressure algometry assay detected differences between sham and dNP+ groups only at week 2 (Figure 6B). However, this assay was successful in detecting differences between PBS and sham animal groups at weeks 4, 8, 11, 13, and 15 (Figure 6B). Also, animals in the PBS group displayed significantly decreased thresholds compared to dNP+ animals at week 13, 4 weeks after treatment surgery (Figure 6B, p < 0.05).
The open field test measured changes in movement‐evoked pain‐like behavior. The open field test failed to detect differences between any groups prior to the treatment surgery. However, at week 11, 2 weeks after treatment surgery, dNP+ animals traveled significantly further than both PBS and sham groups (Figure 6C, p < 0.05).
After diclofenac administration, PBS animal grip strengths returned to baseline and were significantly different from week 15 pre‐diclofenac grip strength values and no longer significantly different from sham (Figure 6D). Post diclofenac administration, sham and dNP+ animals grip strength values did not significantly differ from pre‐diclofenac values (Figure 6D). These data confirmed that pain‐like hypersensitivity in this model could be alleviated via approaches used in humans.
Altogether these pain‐like measurements indicated that dNP+ was effective at alleviating pain‐like axial hypersensitivity, and the effect of dNP+ was sustained for 6 weeks after treatment.
3.7. dNP+ Does Not Restore Disc Morphology
H&E image analysis revealed that sham animals displayed large, rounded NPs with an organized, outward‐bulging AF. Injured animals treated with 1X PBS displayed smaller NPs with fewer cells. PBS animals also exhibited a loss in cellularity around the needle tract, disorganized lamellae, and granular stabilizing tissue. dNP+ animals exhibited disc morphology not significantly different from PBS animals (Figure 7A,B). The formation of granulation tissue between the ventral ligament and ventral AF is present in almost all PBS and dNP+ animals (Figure 7A). Additionally, no PBS or dNP+ animals exhibited signs of herniation. When the scores for each individual H&E category were summed, there was a significant increase in score for the PBS and dNP+ groups compared to sham (Figure 7B,C, p < 0.05). Together this indicates that injury significantly changes disc morphology that is not returned to sham morphology with dNP+ treatment.
FIGURE 7.
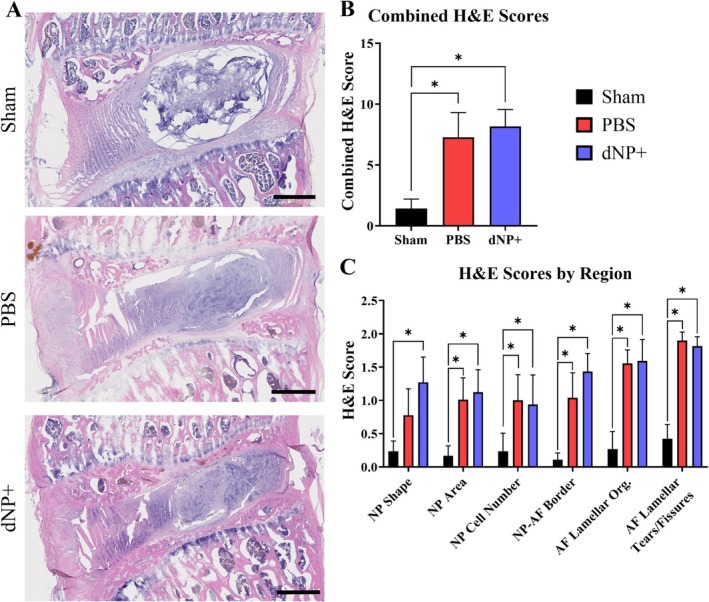
dNP+ does not restore disc morphology. (A) Representative images of L5‐L6 motion segments stained with H&E. Sham discs exhibited large, circular, and highly cellular NPs and AF with organized collagen lamellae. PBS and dNP+ groups showed less cellular and distorted NPs with disrupted and distorted collagen lamellae in the NP (scale bar = 500 μm). (B) Combined H&E scores across all categories. Significant differences were detected between the PBS and sham group and the dNP+ and sham group. (C) H&E scores by category. Significant differences were detected between the PBS and sham group and the dNP+ and sham group in most categories. Three images from each disc were scored and averaged together (sham: N = 10, PBS: N = 11, dNP+ n = 9). H&E category data were analyzed using the Kruskal–Wallis test and Dunn's post hoc test. Combined H&E score data were analyzed using a one‐way ANOVA with Tukey's post hoc test. * = p < 0.05.
3.8. dNP+ Maintains Disc Hypocellularity
In sham animals, high cellularity was observed in the NP, and cells formed a linear pattern in the AF (Figure 8). PBS and dNP+ animals displayed a significant decrease in cellularity in both the NP and the AF. In these groups, cells in the NP formed lacunae, and there was almost a complete elimination of cells around the site of the needle tract in the AF. PBS and dNP+ animals had a significant reduction in cellularity in the outer 1/3 of the ventral AF, inner 2/3 of the ventral AF, NP, and dorsal AF in comparison to sham animals (Figure 8A). Additionally, all PBS and dNP+ animals formed highly cellular granulation tissue between the ventral AF and ventral ligament (Figure 8A,B). There was a significant decrease in total cellularity between PBS and sham animals and between dNP+ and sham animals, both with and without the inclusion of granulation tissue (Figure 8B,C, p < 0.05). Together, these results showed that injury resulted in a decrease in disc cellularity that was not restored with the dNP+ treatment.
FIGURE 8.
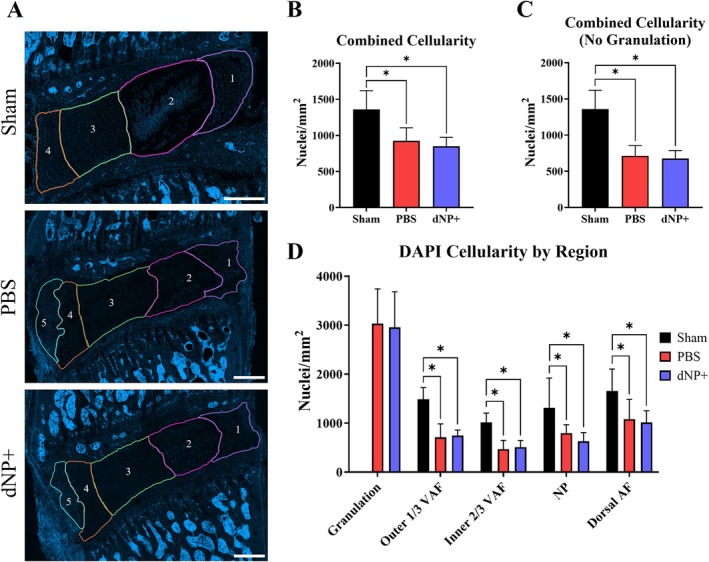
dNP+ maintains disc hypocellularity. (A) Representative images of motion segments stained with DAPI. Regions are as follows: 1 = dorsal AF, 2 = NP, 3 = inner 2/3 ventral AF, 4 = outer 1/3 ventral AF, and 5 = granulation tissue. Sham discs were highly cellular in the NP and AF. PBS and dNP+ discs displayed cell clustering in the NP forming lacunae and less cellularity in the AF, especially along the needle tract. PBS and dNP+ discs also formed highly cellular granulation tissue between the ventral ligament and ventral AF (scale bar = 500 μm). (B) Combined cellularity scores. There was a significant decrease in cellularity between the sham and PBS group and between the sham and dNP+ group. (C) Combined cellularity scores without the inclusion of granulation tissue. There was a significant decrease in cellularity between the sham and PBS group and between the sham and dNP+ group. (D) DAPI cellularity by region. Disc images were manually broken out into groups as described above. There were significant differences in all regions between sham & PBS and sham & dNP+ groups. Three images from each disc were quantified (sham: N = 10, PBS: N = 11, dNP+ n = 9). Cellularity region data were analyzed with the Kruskal–Wallis test and Dunn's post hoc test. Combined cellularity data were analyzed with a one‐way ANOVA with Tukey's post hoc test. * = p < 0.05.
3.9. dNP+ Does Not Alleviate Nerve Sprouting in the Disc
IHC was used to determine if motion segment sections exhibited aberrant nerve growth. Sham animals displayed minimal positive nerve staining in the disc region, with most nerves present in the outer 1/3 of the ventral AF indicated by both PGP9.5 and CGRP staining (Figure 9A,B). PBS animals had a significant amount of PGP9.5 staining only in the dorsal AF when compared to sham (Figure 9C). Comparatively, PBS animals exhibited a significant amount of CGRP staining in the inner 2/3 of the ventral AF, the NP, and in the dorsal AF when compared to sham (Figure 9E). dNP+ animals had a significant amount of PGP9.5 and CGRP positive staining in the inner 2/3 of the ventral AF and dorsal AF when compared to sham (Figure 9C,E, p < 0.05). When assessing the total innervation of all regions, PBS animals displayed a significant increase in both PGP9.5 and CGRP positive staining (Figure 9D,F). In contrast, dNP+ animals only displayed a significant increase in PGP9.5 staining when compared to sham (Figure 9D,F). Together, these results indicate that injury increases the amount of innervation in the disc that is not alleviated by dNP+ treatment.
FIGURE 9.
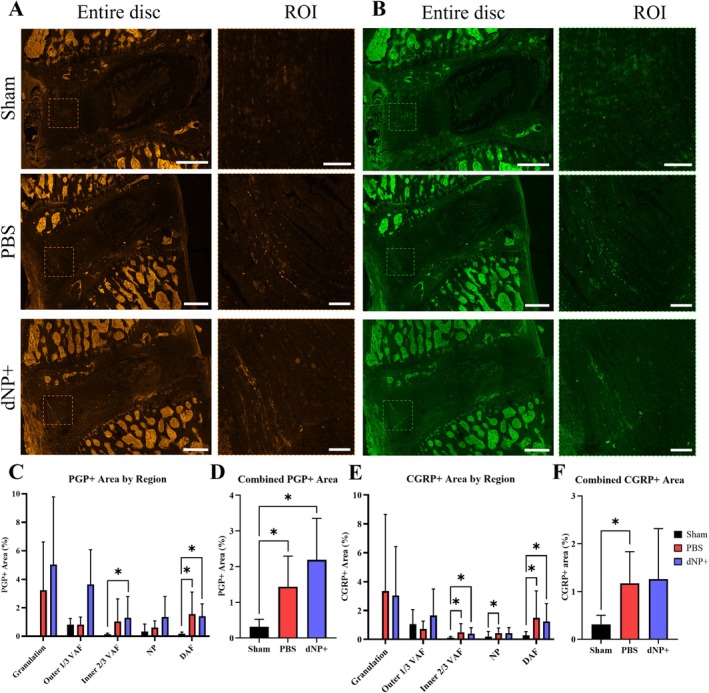
PBS and dNP+ treatment results in an increase in aberrant nerve growth. (A) Brightness‐enhanced representative images of motion segments stained with PGP9.5. ROIs focus on nerve growth in the ventral AF (VAF). Sham animals display little positivity in the disc region. PBS and dNP+ animals display more positive staining in the disc region compared to sham (entire disc scale bar = 500 μm & ROI scale bar = 100 μm). (B) Representative images of motion segments stained with CGRP. ROIs highlight peptidergic nerve growth in the ventral AF. CGRP staining in sham animals appears dark across the entire disc. PBS and dNP+ groups display increased CGRP positivity across many regions in the disc (entire disc scale bar = 500 μm & ROI scale bar = 100 μm). (C) PGP9.5 positive staining by region. Discs were manually broken up into regions, as done for DAPI staining. PBS and dNP+ animals had a significant increase in staining in the dorsal AF (DAF) compared to sham animals. dNP+ animals had a significant increase in PGP9.5 staining in the inner 2/3 of the ventral AF compared to sham animals. (D) Combined PGP9.5 positive staining across the entire disc. There was a significant increase in PGP9.5 staining in the PBS and dNP+ groups when compared to sham. (E) CGRP positive staining by disc region. There is a significant increase in CGRP positivity in the inner 2/3 of the VAF, NP, and DAF in the PBS group compared to sham. dNP+ animals displayed an increase in CGRP positive staining in the inner 2/3 of the ventral AF and dorsal AF compared to sham. (F) Combined CGRP positive staining across the entire disc. There was a significant increase in CGRP staining in the PBS group when compared to sham. PGP and CGRP positivity were analyzed with the Kruskal–Wallis test and Dunn's post hoc test. * = p < 0.05.
3.10. dNP+ μCT Is Correlated With Pain‐Like Behavior
Correlation analyses were performed to assess the relationship between week 15 normalized disc volume and week 15 normalized grip strength values, both with and without the dNP+ group (Figure 10A,B). Analysis with the dNP+ group resulted in a significant positive relationship between disc volume and pain‐like behavior (Figure 10A). Additionally, when the dNP+ group was removed, the relationship remained significant.
FIGURE 10.
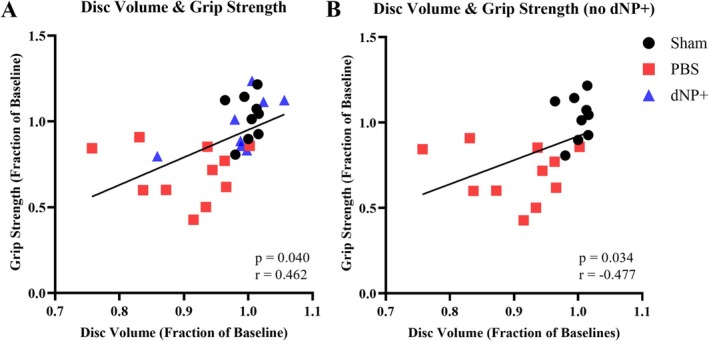
Disc volume and grip strength exhibit significant relationships both with and without dNP+. (A) Correlation between normalized disc volume and normalized grip strength shows a significant relationship. (B) Correlation between normalized disc volume and normalized grip strength without dNP+ shows a significant relationship. Correlations calculated using the Pearson correlation coefficient. The solid black line shows a linear regression line. One animal from the dNP+ group due to its normalized disc volume is an outlier.
3.11. dNP+ Nerve Staining Is Not Correlated With Pain‐Like Behavior
A correlation analysis was performed to assess the relationship between nerve staining and week 15 normalized grip strength values (Figure S2). This analysis revealed a non‐significant relationship between nerve staining and pain‐like behavior when all groups were assessed together (Figure S2A,B). However, when the dNP+ group was removed from the analysis, there was a significantly negative relationship between total CGRP+ area and normalized grip strength values (Figure S2D). Similarly, the relationship between total PGP+ area and normalized grip strength values narrowly missed significance (p = 0.067) (Figure S2C).
3.12. dNP+ Confounds Several Relationships Between Assessed Metrics
A correlation matrix was created to identify significant relationships existing between study metrics for all animals (sham, injured, dNP+) or just sham and injured animals (Figure S3A,B). Both correlation matrices showed significant relationships between PGP+ and CGRP+ staining, between disc volume and grip strength, between disc volume and pressure algometry, as well as several relationships with H&E scores (Figure S3A,B). The dNP+ correlation matrix also exhibited significant relationships between PGP+ area and disc cellularity and between CGRP+ area and distance traveled (Figure S3A). The correlation matrix without the dNP+ resulted in a greater number of significant relationships. These relationships include between PGP+ area and disc volume, between CGRP+ area and grip strength, between CGRP+ and pressure algometry, between CGRP+ area and disc volume, between grip strength and disc cellularity, between pressure algometry and disc volume, and between disc volume and distance traveled (Figure S3B).
4. Discussion
This work provides evidence that a biomaterial composed of decellularized healthy porcine NP, type I collagen, and genipin can be an effective therapeutic for disc‐associated LBP. In our rat model, dNP+ treatment restored degenerated disc volume to baseline, and this effect was maintained at all time points measured after treatment. Further, animals treated with dNP+ displayed remarkably diminished axial hypersensitivity, which was maintained at all time points after the treatment surgery.
Genipin was selected as the crosslinker for dNP+ because it provided a dramatic increase in storage modulus (+216%) compared to dNP alone. Geneipin was compared to lysyl oxidase, which only increased the storage modulus by 7%. Further, the timeframe in which genipin crosslinked our hydrogels aligned with previously existing literature [38], indicating that this process would occur during surgical recovery in the animal model. However, some previous work demonstrated genipin can be cytotoxic [45]. These data indicated that 2.5 mM genipin was a conservative concentration to use to avoid the presence of free genipin and in turn cytotoxicity. Furthermore, our direct testing of dNP+ for cytotoxicity in human NP cells revealed that the dNP+ hydrogel did not have any cytotoxic effects.
Ex vivo characterization of injured motion segments treated with dNP+ exhibited significantly increased mechanical properties compared to pre‐treatment values. The 15% increase in storage modulus represented around a 200 000 Pa increase, which was multiple orders of magnitude greater than the dNP+ gel alone. We believe this increase was a combination of the effect of genipin on the existing tissue and annealing of the injury defect by dNP+.
Directly after injury, the disc volume of injured animals dramatically declined herein and in our previous work [37]. After treatment surgery, dNP+ treated disc volumes returned to baseline while PBS‐treated discs remained significantly lower than sham‐ and dNP+ treated disc volumes. Both injured + PBS and injured + dNP+ exhibited similar amounts of granulation tissue, which is common in injury models and thought to help stabilize the disc. These data provided compelling evidence that dNP+ successfully entered and remained in the disc throughout the time course of the study.
Similar to prior work, injured animals displayed a gradual decline in grip strength from week 2 to week 8, indicative of axial hypersensitivity [46, 47]. Further, PBS‐treated animals' grip strength continued to decline after treatment surgery. Conversely, dNP+ treated animals grip strength increased after treatment surgery, suggesting that the treatment alleviated axial hypersensitivity. At week 15, the dNP+ grip strength was 26% higher than PBS‐treated animals. This difference is more than double the minimal clinically important difference (MCID) that has been recommended for LBP treatment outcome measures [48]. The grip strength data provide strong evidence that dNP+ could be an effective treatment for axial pain caused by disc degeneration.
The pressure algometry data proved more difficult to interpret as dNP+ animals significantly differed from sham animals only at week 2. The failure to develop deep pressure hypersensitivity prior to the treatment surgery limited our understanding of the effect of dNP+ on deep pressure hypersensitivity. On the contrary, PBS animal thresholds were significantly lower than sham at multiple time points before and after surgery. Also, at week 13, PBS thresholds were 16% lower than dNP+ animals, which exceeded the MCID. These data indicated that injury did produce deep pressure hypersensitivity, but the variability of the assay, especially in dNP+ animals, limited our interpretation of the treatment effect.
The movement‐evoked pain‐like behavior, as measured in the open field test, provided additional evidence that dNP+ treatment had an analgesic effect. This effect manifested in week 11, 2 weeks after treatment surgery. Similar to week 2, which was 2 weeks after injury surgery, sham and PBS animals traveled less distance. Intriguingly, dNP+ animals traveled significantly more than both PBS and sham animals, and this effect was highly significant (p < 0.0029 dNP+ vs. sham, p < 0.0006 dNP+ vs. PBS). We reason that dNP+ may have provided an analgesic effect that was greater than the inhibitory action of post‐surgical effects causing the animals to roam more. Regardless of the cause, the increase in distance traveled did not continue into weeks 13 and 15. This data mirrors clinical interventions in humans for disc‐associated LBP, where pain relief, as measured by the visual analog scale (VAS), is highest immediately after surgery and lessens as time goes on [49]. The open field test confirmed that dNP+ had an effect on spontaneous pain‐like behavior, but this effect was not significantly maintained.
Diclofenac was administered in week 15 primarily to verify the predictive validity of this model. Diclofenac is a non‐steroidal anti‐inflammatory drug (NSAID) that acts as an analgesic by inhibiting cyclooxygenase 1 and 2 (COX‐1 and COX‐2) [50]. This drug has proven efficacious in humans suffering acute episodes of non‐radicular LBP and in animal models which exhibit mechanical hypersensitivity and decreased motor ability [42, 43, 51, 52]. Additionally, NSAIDs such as diclofenac have exhibited efficacy in some populations of chronic LBP patients [53, 54]. Similarly, diclofenac effectively reduced axial hypersensitivity in our model. This outcome confirmed that disc‐associated pain in our model could be alleviated via mechanistic approaches applied in humans and that dNP+ likely worked in a similar manner.
Analysis of disc morphology and nerve sprouting revealed no changes between the dNP+ group and PBS group. When assessed in conjunction with pain‐like behavior data, these changes suggest that dNP+ likely mechanically stabilized the disc but did not remove or prevent the growth of nerve fibers. This notion may be supported by the significant correlation between normalized disc volume and pain‐like behavior. These results showed a significant positive relationship between disc volume and normalized grip strength values. Additionally, the correlation matrix indicated a significant relationship between disc volume and pressure algometry. This stabilization would prevent mechanical perturbations from stimulating nerve fibers in the disc and thus prevent pain‐like behavior in dNP+ animals. The dNP+ group not only had a level of nerve staining similar to the PBS group but also had relief of their pain‐like behavior, resulting in a non‐significant correlation between nerve staining and normalized grip strength. However, when the correlation was conducted without the dNP+ group, there was a significant relationship between CGRP+ area and normalized grip strength values. This indicates that the presence of peptidergic nerve fibers may play a role in the pain‐like behavior displayed in the PBS group. However, other factors may be preventing the stimulation of these fibers in the dNP+ group, resulting in alleviation of the pain‐like behavior. Additionally, since histological outcomes between dNP+ and PBS groups were not significantly different, these data indicated that dNP+ treatment did not promote tissue repair and again likely served as a mechanical stabilizer.
This work has a few limitations in addition to those already mentioned. First, only female animals were used, disallowing any insight into the role of sexual dimorphism on treatment effects. Second, the mechanical stability of the disc was not verified after explant of in vivo samples. Therefore, further work is needed to characterize the mechanics of treated discs to verify that they are truly more mechanically stable.
Chronic LBP is a tremendous burden on modern society. There is a great need for therapeutics which address the fundamental cause of pain. It has become increasingly clear in recent years that a reliance on central or systemic medicines like opioids and NSAIDs has only increased the societal burden of chronic LBP. To this end, we have engineered a non‐invasive, spontaneously assembling, therapeutic derived from healthy disc tissue that remarkably decreases pain‐like behavior in animals suffering from disc‐associated LBP. We hope this work will provide the basis of a next generation therapy for LBP and will assist other research groups in developing similar treatments.
Author Contributions
David J. Lillyman: conceptualization, methodology, investigation, writing – original draft, visualization, and formal analysis. Evie C. Reddick: investigation, writing – original draft, writing – review and editing, visualization, formal analysis. Kayla E. Ney: investigation. Sydney M. Caparaso: investigation. Rebecca A. Wachs: conceptualization, methodology, supervision, writing – review and editing, funding acquisition.
Conflicts of Interest
David J. Lillyman and Rebecca A. Wachs are currently pursuing a patent application for the dNP+ material, US Patent App. 18/445466.
Supporting information
Figure S1. dNP hydrogels spontaneously gel and crosslink. (A) Absorbance of dNP gels at 405 nm over 12 h of incubation at 37°C. All gels exhibited rapid fibrillogenesis in the first 20 min of incubation as highlighted in (B). The continual increase of absorbance at 405 nm after 2 h was largely due to light absorbance by genipin blue, produced during crosslinking. (C) Absorbance of dNP gels at 610 nm over 12 h of incubation at 37°C. As part of the crosslinking reaction, genipin forms genipin blue, which absorbs light at 610 nm. 20 mM genipin dNP gels were the first to exhibit a dramatic increase in absorbance, although all genipin supplemented gels increased in absorbance at 610 nm. The final absorbance values for 10 and 20 mM dNP gels were similar, suggesting that all crosslinking sites were exhausted at around 10 mM genipin. The final absorbance of 2.5 mM genipin was at the midpoint between 20 and 0 mM. (D) All gels exhibited genipin crosslinking initiation between 1:30:00 and 3:30:00. (E) Visual appearance of the dNP hydrogels after 12 h of incubation at 37°C.
Figure S2. dNP+ results in a non‐significant relationship between nerve growth and grip strength. (A) Correlation showing relationship between PGP+ area and normalized week 15 grip strength values. This relationship is not significant as dNP+ animals display high PGP+ staining and high normalized grip strength values. (B) Correlation showing relationship between CGRP+ area and normalized week 15 grip strength values. This relationship is not significant as dNP+ animals display high CGRP+ staining and high normalized grip strength values. (C) Correlation showing relationship between PGP+ area and normalized grip strength values without the dNP+ group. This correlation narrowly missed significance (p = 0.067), indicating that there is a trend toward increasing PGP+ area and decreasing grip strength values. (D) Correlation showing relationship between CGRP+ area and normalized grip strength values without the dNP+ group. This correlation was significant, indicating that there is a relationship between increasing CGRP+ area and decreasing grip strength values. Graphs shown with linear regression lines. Correlations calculated using the Pearson correlation coefficient.
Figure S3. Correlation matrix without dNP+ results in more significant relationships between study outcomes. (A) Correlation matrix showing the relationship between study metrics with all groups included. Significant relationships of note include between disc volume and grip strength and between disc volume and pressure algometry. (B) Correlation matrix showing the relationship between study metrics without the inclusion of dNP+. Significant relationships of note include between CGRP+ area and grip strength, PGP+ area and disc volume CGRP+ area and disc volume, grip strength and disc volume, grip strength and disc cellularity, and several metrics when compared to H&E scores. Correlations calculated using Pearson correlation coefficients. *p < 0.05.
Acknowledgments
This research was funded in part by the Nebraska Tobacco Settlement Biomedical Research Development Fund. We would like to acknowledge the staff at the Life Sciences Annex at the University of Nebraska–Lincoln, especially veterinarian Anna Fitzwater, who performed the animal surgeries. Additionally, we would like to acknowledge Adan Redwine, Anna Levorson, Furqan Mahdi, and Uyen Nguyen for assisting in this study. Finally, we would like to thank Dr. Richard Bell at the Hospital for Special Surgery for imaging our H&E slides.
Funding: This work was supported by the Nebraska Tobacco Settlement Biomedical Research Development Fund.
References
- 1. James S. L., Abate D., Abate K. H., et al., “Global, Regional, and National Incidence, Prevalence, and Years Lived With Disability for 354 Diseases and Injuries for 195 Countries and Territories, 1990–2017: A Systematic Analysis for the Global Burden of Disease Study 2017,” Lancet 392, no. 10159 (2018): 1789–1858. [DOI] [PMC free article] [PubMed] [Google Scholar]
- 2. Hestbaek L., Leboeuf‐Yde C., and Manniche C., “Low Back Pain: What Is the Long‐Term Course? A Review of Studies of General Patient Populations,” European Spine Journal 12, no. 2 (2003): 149–165, 10.1007/s00586-002-0508-5. [DOI] [PMC free article] [PubMed] [Google Scholar]
- 3. Martin B. I., Deyo R. A., Mirza S. K., et al., “Expenditures and Health Status Among Adults With Back and Neck Problems,” Journal of the American Medical Association 299, no. 6 (2008): 656–664. [DOI] [PubMed] [Google Scholar]
- 4. Racine M., “Chronic Pain and Suicide Risk: A Comprehensive Review,” Progress in Neuro‐Psychopharmacology and Biological Psychiatry 87 (2018): 269–280, 10.1016/j.pnpbp.2017.08.020. [DOI] [PubMed] [Google Scholar]
- 5. Shmagel A., Foley R., and Ibrahim H., “Epidemiology of Chronic Low Back Pain in US Adults: Data From the 2009‐2010 National Health and Nutrition Examination Survey,” Arthritis Care and Research 68, no. 11 (2016): 1688–1694, 10.1002/acr.22890. [DOI] [PMC free article] [PubMed] [Google Scholar]
- 6. DePalma M. J., Ketchum J. M., and Saullo T., “What Is the Source of Chronic Low Back Pain and Does Age Play a Role?,” Pain Medicine 12, no. 2 (2011): 224–233. [DOI] [PubMed] [Google Scholar]
- 7. Hadjipavlou A. G., Tzermiadianos M. N., Bogduk N., and Zindrick M. R., “The Pathophysiology of Disc Degeneration,” Journal of Bone and Joint Surgery (British Volume) 90‐B, no. 10 (2008): 1261–1270, 10.1302/0301-620X.90B10.20910. [DOI] [PubMed] [Google Scholar]
- 8. Coppes M. H., Marani E., Thomeer R. T., and Groen G. J., “Innervation of “Painful” Lumbar Discs,” Spine 22, no. 20 (1997): 2342–2349, 10.1097/00007632-199710150-00005. [DOI] [PubMed] [Google Scholar]
- 9. Lotz J. C. and Ulrich J. A., “Innervation, Inflammation, and Hypermobility May Characterize Pathologic Disc Degeneration: Review of Animal Model Data,” JBJS 88, no. suppl_2 (2006): 76–82. [DOI] [PubMed] [Google Scholar]
- 10. Chung S., Lee J., and Yoon J., “Effects of Stabilization Exercise Using a Ball on Mutifidus Cross‐Sectional Area in Patients With Chronic Low Back Pain,” Journal of Sports Science and Medicine 12, no. 3 (2013): 533–541. [PMC free article] [PubMed] [Google Scholar]
- 11. Fairbank J., Frost H., Wilson‐MacDonald J., Yu L.‐M., Barker K., and Collins R., “Randomised Controlled Trial to Compare Surgical Stabilisation of the Lumbar Spine With an Intensive Rehabilitation Programme for Patients With Chronic Low Back Pain: The MRC Spine Stabilisation Trial,” British Medical Journal 330, no. 7502 (2005): 1233, 10.1136/bmj.38441.620417.8F. [DOI] [PMC free article] [PubMed] [Google Scholar]
- 12. Lu Y., Guzman J. Z., Purmessur D., et al., “Nonoperative Management of Discogenic Back Pain: A Systematic Review,” Spine 39, no. 16 (2014): 1314–1324, 10.1097/BRS.0000000000000401. [DOI] [PMC free article] [PubMed] [Google Scholar]
- 13. Ma S.‐Y. and Kim H.‐D., “The Efficacy of Spinal Decompression via DRX3000 Combined With a Spinal Mobilization and a Lumbar Stabilization Exercise Program for Patients With Discogenic Low Back Pain,” Journal of Physical Therapy Science 22, no. 4 (2010): 345–354, 10.1589/jpts.22.345. [DOI] [Google Scholar]
- 14. Parker L. M., Murrell S. E., Boden S. D., and Horton W. C., “The Outcome of Posterolateral Fusion in Highly Selected Patients With Discogenic Low Back Pain,” Spine 21, no. 16 (1996): 1909–1916. [DOI] [PubMed] [Google Scholar]
- 15. Sarafadeen R., Ganiyu S. O., and Ibrahim A. A., “Effects of Spinal Stabilization Exercise With Real‐Time Ultrasound Imaging Biofeedback in Individuals With Chronic Nonspecific Low Back Pain: A Pilot Study,” Journal of Exercise Rehabilitation 16, no. 3 (2020): 293–299, 10.12965/jer.2040380.190. [DOI] [PMC free article] [PubMed] [Google Scholar]
- 16. García‐Cosamalón J., del Valle M. E., Calavia M. G., et al., “Intervertebral Disc, Sensory Nerves and Neurotrophins: Who Is Who in Discogenic Pain?,” Journal of Anatomy 217, no. 1 (2010): 1–15, 10.1111/j.1469-7580.2010.01227.x. [DOI] [PMC free article] [PubMed] [Google Scholar]
- 17. Adams M. A. and Roughley P. J., “What Is Intervertebral Disc Degeneration, and What Causes It?,” Spine 31, no. 18 (2006): 2151–2161, 10.1097/01.brs.0000231761.73859.2c. [DOI] [PubMed] [Google Scholar]
- 18. Chan D., Song Y., Sham P., and Cheung K. M., “Genetics of Disc Degeneration,” European Spine Journal 15, no. 3 (2006): 317–325. [DOI] [PMC free article] [PubMed] [Google Scholar]
- 19. Burke J. G., Watson R. W., McCormack D., Dowling F. E., Walsh M. G., and Fitzpatrick J. M., “Intervertebral Discs Which Cause Low Back Pain Secrete High Levels of Proinflammatory Mediators,” Journal of Bone and Joint Surgery 84, no. 2 (2002): 196–201, 10.1302/0301-620x.84b2.12511. [DOI] [PubMed] [Google Scholar]
- 20. Vo N. V., Hartman R. A., Yurube T., Jacobs L. J., Sowa G. A., and Kang J. D., “Expression and Regulation of Metalloproteinases and Their Inhibitors in Intervertebral Disc Aging and Degeneration,” Spine Journal: Official Journal of the North American Spine Society 13, no. 3 (2013): 331–341, 10.1016/j.spinee.2012.02.027. [DOI] [PMC free article] [PubMed] [Google Scholar]
- 21. Wuertz K. and Haglund L., “Inflammatory Mediators in Intervertebral Disk Degeneration and Discogenic Pain,” Global Spine Journal 3, no. 3 (2013): 175–184, 10.1055/s-0033-1347299. [DOI] [PMC free article] [PubMed] [Google Scholar]
- 22. Johnson Z. I., Schoepflin Z. R., Choi H., Shapiro I. M., and Risbud M. V., “Disc in Flames: Roles of TNF‐α and IL‐1β in Intervertebral Disc Degeneration,” European Cells and Materials 30 (2015): 104. [DOI] [PMC free article] [PubMed] [Google Scholar]
- 23. Tian Y., Yuan W., Fujita N., et al., “Inflammatory Cytokines Associated With Degenerative Disc Disease Control Aggrecanase‐1 (ADAMTS‐4) Expression in Nucleus Pulposus Cells Through MAPK and NF‐κB,” American Journal of Pathology 182, no. 6 (2013): 2310–2321, 10.1016/j.ajpath.2013.02.037. [DOI] [PMC free article] [PubMed] [Google Scholar]
- 24. Wang J., Markova D., Anderson D. G., Zheng Z., Shapiro I. M., and Risbud M. V., “TNF‐Alpha and IL‐1beta Promote a Disintegrin‐Like and Metalloprotease With Thrombospondin Type I Motif‐5‐Mediated Aggrecan Degradation Through Syndecan‐4 in Intervertebral Disc,” Journal of Biological Chemistry 286, no. 46 (2011): 39738–39749, 10.1074/jbc.M111.264549. [DOI] [PMC free article] [PubMed] [Google Scholar]
- 25. Johnson W. E., Caterson B., Eisenstein S. M., Hynds D. L., Snow D. M., and Roberts S., “Human Intervertebral Disc Aggrecan Inhibits Nerve Growth In Vitro,” Arthritis and Rheumatism 46, no. 10 (2002): 2658–2664, 10.1002/art.10585. [DOI] [PubMed] [Google Scholar]
- 26. Melrose J., Roberts S., Smith S., Menage J., and Ghosh P., “Increased Nerve and Blood Vessel Ingrowth Associated With Proteoglycan Depletion in an Ovine Anular Lesion Model of Experimental Disc Degeneration,” Spine 27, no. 12 (2002): 1278–1285. [DOI] [PubMed] [Google Scholar]
- 27. Stokes I. A., Counts D. F., and Frymoyer J. W., “Experimental Instability in the Rabbit Lumbar Spine,” Spine (Phila Pa 1976) 14, no. 1 (1989): 68–72, 10.1097/00007632-198901000-00014. [DOI] [PubMed] [Google Scholar]
- 28. Fukui D., Kawakami M., Yoshida M., Nakao S.‐i., Matsuoka T., and Yamada H., “Gait Abnormality due to Spinal Instability After Lumbar Facetectomy in the Rat,” European Spine Journal 24, no. 9 (2015): 2085–2094. [DOI] [PubMed] [Google Scholar]
- 29. Gong K., Shao W., Chen H., Wang Z., and Luo Z.‐J., “Rat Model of Lumbar Facet Joint Osteoarthritis Associated With Facet‐Mediated Mechanical Hyperalgesia Induced by Intra‐Articular Injection of Monosodium Iodoacetate,” Journal of the Formosan Medical Association 110, no. 3 (2011): 145–152. [DOI] [PubMed] [Google Scholar]
- 30. Oichi T., Taniguchi Y., Soma K., et al., “A Mouse Intervertebral Disc Degeneration Model by Surgically Induced Instability,” Spine 43, no. 10 (2018): E557–E564, 10.1097/brs.0000000000002427. [DOI] [PubMed] [Google Scholar]
- 31. Suri P., Miyakoshi A., Hunter D. J., et al., “Does Lumbar Spinal Degeneration Begin With the Anterior Structures? A Study of the Observed Epidemiology in a Community‐Based Population,” BMC Musculoskeletal Disorders 12, no. 1 (2011): 202, 10.1186/1471-2474-12-202. [DOI] [PMC free article] [PubMed] [Google Scholar]
- 32. Fritzell P., Hägg O., Wessberg P., Nordwall A., and Group SLSS , “2001 Volvo Award Winner in Clinical Studies: Lumbar Fusion Versus Nonsurgical Treatment for Chronic Low Back Pain: A Multicenter Randomized Controlled Trial From the Swedish Lumbar Spine Study Group,” Spine 26, no. 23 (2001): 2521–2532. [DOI] [PubMed] [Google Scholar]
- 33. Fritzell P., Hägg O., Wessberg P., Nordwall A., and Group SLSS , “Chronic Low Back Pain and Fusion: A Comparison of Three Surgical Techniques: A Prospective Multicenter Randomized Study From the Swedish Lumbar Spine Study Group,” Spine (Phila Pa 1976) 27, no. 11 (2002): 1131–1141, 10.1097/00007632-200206010-00002. [DOI] [PubMed] [Google Scholar]
- 34. Mirza S. K. and Deyo R. A., “Systematic Review of Randomized Trials Comparing Lumbar Fusion Surgery to Nonoperative Care for Treatment of Chronic Back Pain,” Spine 32, no. 7 (2007): 816–823. [DOI] [PubMed] [Google Scholar]
- 35. Piening L. M., Lillyman D. J., Lee F. S., Lozano A. M., Miles J. R., and Wachs R. A., “Injectable Decellularized Nucleus Pulposus Tissue Exhibits Neuroinhibitory Properties,” Jor Spine 5 (2022): e1187, 10.1002/jsp2.1187. [DOI] [PMC free article] [PubMed] [Google Scholar]
- 36. Antoniou J., Steffen T., Nelson F., et al., “The Human Lumbar Intervertebral Disc: Evidence for Changes in the Biosynthesis and Denaturation of the Extracellular Matrix With Growth, Maturation, Ageing, and Degeneration,” Journal of Clinical Investigation 98, no. 4 (1996): 996–1003, 10.1172/JCI118884. [DOI] [PMC free article] [PubMed] [Google Scholar]
- 37. Lillyman D. J., Lee F. S., Barnett E. C., et al., “Axial Hypersensitivity Is Associated With Aberrant Nerve Sprouting in a Novel Model of Disc Degeneration in Female Sprague Dawley Rats,” JOR Spine 5, no. 3 (2022): e1212, 10.1002/jsp2.1212. [DOI] [PMC free article] [PubMed] [Google Scholar]
- 38. Hwang Y.‐J., Larsen J., Krasieva T. B., and Lyubovitsky J. G., “Effect of Genipin Crosslinking on the Optical Spectral Properties and Structures of Collagen Hydrogels,” ACS Applied Materials and Interfaces 3, no. 7 (2011): 2579–2584, 10.1021/am200416h. [DOI] [PMC free article] [PubMed] [Google Scholar]
- 39. Cheng J. S., Carr C. B., Wong C., Sharma A., Mahfouz M. R., and Komistek R. D., “Altered Spinal Motion in Low Back Pain Associated With Lumbar Strain and Spondylosis,” Evidence‐Based Spine‐Care Journal 4, no. 1 (2013): 6–12, 10.1055/s-0033-1341640. [DOI] [PMC free article] [PubMed] [Google Scholar]
- 40. Bosgraaf C., Suchy H., Harrison C., and Toth L. A., “Diagnosis: Pica Secondary to Buprenorphine Administration,” Lab Animal 2004, no. 33 (2004): 22–23, 10.1038/laban0304-22. [DOI] [Google Scholar]
- 41. Lillyman D. J., Barnett E. C., Miller T. J., and Wachs R. A., “Application of Microcomputed Tomography to Calculate Rat Intervertebral Disc Volume as a Surrogate Measure of Degeneration,” Computer Methods in Biomechanics and Biomedical Engineering: Imaging and Visualization 11, no. 5 (2023): 1717–1723, 10.1080/21681163.2023.2182607. [DOI] [Google Scholar]
- 42. Ximenes A., Robles M., Sands G., and Vinueza R., “Valdecoxib Is as Efficacious as Diclofenac in the Treatment of Acute Low Back Pain,” Clinical Journal of Pain 23, no. 3 (2007): 244–250. [DOI] [PubMed] [Google Scholar]
- 43. Schattenkirchner M. and Milachowski K., “A Double‐Blind, Multicentre, Randomised Clinical Trial Comparing the Efficacy and Tolerability of Aceclofenac With Diclofenac Resinate in Patients With Acute Low Back Pain,” Clinical Rheumatology 22, no. 2 (2003): 127–135. [DOI] [PubMed] [Google Scholar]
- 44. Lai A., Gansau J., Gullbrand S. E., et al., “Development of a Standardized Histopathology Scoring System for Intervertebral Disc Degeneration in Rat Models: An Initiative of the ORS Spine Section,” Jor Spine 4, no. 2 (2021): e1150, 10.1002/jsp2.1150. [DOI] [PMC free article] [PubMed] [Google Scholar]
- 45. Schek R. M., Michalek A. J., and Iatridis J. C., “Genipin‐Crosslinked Fibrin Hydrogels as a Potential Adhesive to Augment Intervertebral Disc Annulus Repair,” European Cells and Materials 21 (2011): 373–383, 10.22203/ecm.v021a28. [DOI] [PMC free article] [PubMed] [Google Scholar]
- 46. Millecamps M. and Stone L. S., “Delayed Onset of Persistent Discogenic Axial and Radiating Pain After a Single‐Level Lumbar Intervertebral Disc Injury in Mice,” Pain 159, no. 9 (2018): 1843–1855. [DOI] [PubMed] [Google Scholar]
- 47. Millecamps M., Tajerian M., Naso L., Sage E. H., and Stone L. S., “Lumbar Intervertebral Disc Degeneration Associated With Axial and Radiating Low Back Pain in Ageing SPARC‐Null Mice,” Pain 153, no. 6 (2012): 1167–1179. [DOI] [PubMed] [Google Scholar]
- 48. Bombardier C., Hayden J., and Beaton D. E., “Minimal Clinically Important Difference. Low Back Pain: Outcome Measures,” Journal of Rheumatology 28, no. 2 (2001): 431. [PubMed] [Google Scholar]
- 49. Oba H., Takahashi J., Tsutsumimoto T., et al., “Predictors of Improvement in Low Back Pain After Lumbar Decompression Surgery: Prospective Study of 140 Patients,” Journal of Orthopaedic Science 22, no. 4 (2017): 641–646, 10.1016/j.jos.2017.03.011. [DOI] [PubMed] [Google Scholar]
- 50. Gan T. J., “Diclofenac: An Update on Its Mechanism of Action and Safety Profile,” Current Medical Research and Opinion 26, no. 7 (2010): 1715–1731, 10.1185/03007995.2010.486301. [DOI] [PubMed] [Google Scholar]
- 51. Ter Heegde F., Luiz A. P., Santana‐Varela S., et al., “Noninvasive Mechanical Joint Loading as an Alternative Model for Osteoarthritic Pain,” Arthritis and Rheumatology 71, no. 7 (2019): 1078–1088. [DOI] [PMC free article] [PubMed] [Google Scholar]
- 52. Irizarry E., Restivo A., Salama M., et al., “A Randomized Controlled Trial of Ibuprofen Versus Ketorolac Versus Diclofenac for Acute, Nonradicular Low Back Pain,” Academic Emergency Medicine 28, no. 11 (2021): 1228–1235, 10.1111/acem.14321. [DOI] [PubMed] [Google Scholar]
- 53. Enthoven W. T., Roelofs P. D., Deyo R. A., van Tulder M. W., and Koes B. W., “Non‐Steroidal Anti‐Inflammatory Drugs for Chronic Low Back Pain,” Cochrane Database of Systematic Reviews 2, no. 2 (2016): CD012087, 10.1002/14651858.CD012087. [DOI] [PMC free article] [PubMed] [Google Scholar]
- 54. White A. P., Arnold P. M., Norvell D. C., Ecker E., and Fehlings M. G., “Pharmacologic Management of Chronic Low Back Pain: Synthesis of the Evidence,” Spine 36, no. 21 Suppl (2011): S131–S143, 10.1097/BRS.0b013e31822f178f. [DOI] [PubMed] [Google Scholar]
Associated Data
This section collects any data citations, data availability statements, or supplementary materials included in this article.
Supplementary Materials
Figure S1. dNP hydrogels spontaneously gel and crosslink. (A) Absorbance of dNP gels at 405 nm over 12 h of incubation at 37°C. All gels exhibited rapid fibrillogenesis in the first 20 min of incubation as highlighted in (B). The continual increase of absorbance at 405 nm after 2 h was largely due to light absorbance by genipin blue, produced during crosslinking. (C) Absorbance of dNP gels at 610 nm over 12 h of incubation at 37°C. As part of the crosslinking reaction, genipin forms genipin blue, which absorbs light at 610 nm. 20 mM genipin dNP gels were the first to exhibit a dramatic increase in absorbance, although all genipin supplemented gels increased in absorbance at 610 nm. The final absorbance values for 10 and 20 mM dNP gels were similar, suggesting that all crosslinking sites were exhausted at around 10 mM genipin. The final absorbance of 2.5 mM genipin was at the midpoint between 20 and 0 mM. (D) All gels exhibited genipin crosslinking initiation between 1:30:00 and 3:30:00. (E) Visual appearance of the dNP hydrogels after 12 h of incubation at 37°C.
Figure S2. dNP+ results in a non‐significant relationship between nerve growth and grip strength. (A) Correlation showing relationship between PGP+ area and normalized week 15 grip strength values. This relationship is not significant as dNP+ animals display high PGP+ staining and high normalized grip strength values. (B) Correlation showing relationship between CGRP+ area and normalized week 15 grip strength values. This relationship is not significant as dNP+ animals display high CGRP+ staining and high normalized grip strength values. (C) Correlation showing relationship between PGP+ area and normalized grip strength values without the dNP+ group. This correlation narrowly missed significance (p = 0.067), indicating that there is a trend toward increasing PGP+ area and decreasing grip strength values. (D) Correlation showing relationship between CGRP+ area and normalized grip strength values without the dNP+ group. This correlation was significant, indicating that there is a relationship between increasing CGRP+ area and decreasing grip strength values. Graphs shown with linear regression lines. Correlations calculated using the Pearson correlation coefficient.
Figure S3. Correlation matrix without dNP+ results in more significant relationships between study outcomes. (A) Correlation matrix showing the relationship between study metrics with all groups included. Significant relationships of note include between disc volume and grip strength and between disc volume and pressure algometry. (B) Correlation matrix showing the relationship between study metrics without the inclusion of dNP+. Significant relationships of note include between CGRP+ area and grip strength, PGP+ area and disc volume CGRP+ area and disc volume, grip strength and disc volume, grip strength and disc cellularity, and several metrics when compared to H&E scores. Correlations calculated using Pearson correlation coefficients. *p < 0.05.