

Abstract
Objective: The relationships between histopathology and imaging remain elusive and investigating the underlying causes of tumor microstructure that result in an imaging phenotype is of clinical importance. In the present study, cross-sectional guided biopsy specimens were used to correlate prebioptic magnetic resonance imaging (MRI) with immunohistochemical staining of histopathologic specimens using precise spatial biopsy localization. Methods: Overall, 52 patients with atypical hepatocellular carcinoma (HCC) were included in the present analysis. All patients were imaged with a 1.5 T clinical scanner at least one month prior to biopsy. The contrast-enhanced dynamic sequences were analyzed with quantified signal intensities. The bioptic specimens were obtained by cross-sectional guided biopsy and was further analyzed for cell density, proliferation index (Ki 67), tumor-infiltrating lymphocytes, tumor-stroma ratio. Results: Per high power field, the mean values of the histologic parameters were as follows: the tumor-stroma ratio was 17.1 ± 20, the cell count was 147.0 ± 60.3, the CD45 count was 7.3 ± 8.0 and the Ki 67-index was 16.9 ± 16.5%. There were no statistically significant correlations between the MRI signal intensities and cell count, tumor-stroma ratio and CD45 count. There was a moderate inverse correlation that was identified between arterial phase signal intensities and Ki 67 max (r=-0.41, P=0.002) and Ki 67 mean (r=-0.37, P=0.005). The signal intensities of the hepatobiliary phase were statistically significantly different between high and low proliferating HCC using thresholds of 20% and 10% (P=0.01 and P=0.02, respectively). The resulting AUC for the 10% threshold was 0.73 and 0.67 for the 20% threshold. Conclusion: DCE-MRI is associated with Ki 67 index in atypical HCC. The hepatobiliary phase could discriminate HCCs according to their Ki 67 index. Quantitative MRI could be used as an imaging-based surrogate for proliferative HCC. Further studies are needed to validate the present results.
Keywords: HCC, MRI, proliferation potential
Introduction
The incidence of malignant liver tumors has been increasing in recent years highlighting the importance of correct diagnosis [1-4]. Cross-sectional imaging with computed tomography (CT) and magnetic resonance imaging (MRI) can detect and characterize liver lesions, but in most cases a definitive diagnosis is required by histopathological evaluation [1-4].
Liver biopsy is routinely performed to obtain tissue for characterization of liver tumors [5,6]. Being an invasive procedure, it has a reported complication rate of about 1%. Among these, fatal bleeding is considered to be the most serious complication, which rarely occurs [5-7].
There is increasing clinical and translational research interest and efforts to replace invasive procedures with non-invasive imaging modalities. However, despite recent advances in the evaluation of quantitative analyses including histogram, texture analysis and radiomics analysis [8-12], the diagnostic accuracy of imaging modalities to safely replace bioptic tissue sampling in clinical routine is still lacking. Promising quantitative MRI methods include diffusion-weighted imaging, which is able to reflect tumor microstructure in a more sophisticated way [13,14]. Notably, even morphological sequences can reflect tissue characteristics, including proliferation potential, cellularity and nucleus size in various malignant tumors [11,15-17].
For hepatocellular carcinoma (HCC), the arterial hypervascularization and portal venous wash-out phenomena of cross-sectional imaging are considered diagnostic cornerstones representing neoangiogenesis and malignant transformation, allowing to diagnose the cancer without histopathological confirmation [2,18]. In particular, the diagnosis of HCC can be made on imaging modalities alone, when arterial hypervascularization and portal venous wash-out are seen [2]. However, this is only the case in half of the cases, while the other half of suspicious HCC tumors still require biopsy and histological evaluation [2]. Presumably, quantitative imaging analysis could help to better characterize these patients and possibly reduce the need for biopsies.
Furthermore, there are limited data regarding the exact correlation between quantified signal intensities of MRI and histopathological features of these tumors in prebioptic imaging. A promising recent study investigated the diagnostic capabilities of apparent diffusion coefficient values to predict the amount of tumor cells and histopathological features of biopsied tumors [19]. In another study, T1-mapping was used to better quantify tumor contrast media uptake. This was correlated with the proliferative potential of the HCC [20]. A recent study demonstrated the diagnostic ability of the hepatobiliary phase to discriminate between the recently proposed HCC subtypes [21]. In addition, there is a definite need for imaging studies to explore the associations between the different HCC subtypes, as there is an ongoing characterization by molecular analyses with transcriptomic and genomic analyses [22]. Even at the single cell level, there are marked differences between different HCCs, as shown in patients with and without microvascular invasion [23].
An interesting recent study showed that morphologic imaging features such as tumor shape, mosaic-architecture, and rim arterial enhancement could discriminate between proliferative and non-proliferative HCC subtypes [24]. To this date, it is still unclear, whether morphological MRI sequences are also associated with histopathological findings of liver biopsy samples in an exact spatial correlation with preinterventional MRI. This could provide crucial information about the tumor and probably also help to select the correct localization of the biopsy. Therefore, the purpose of this study was to elucidate possible associations between preinterventional MRI and bioptic specimen of liver biopsies in HCC patients using the exact spatial co-registration.
Materials and methods
This retrospective study was approved by the institutional ethics committee (University of Magdeburg, approval number 43/20) and informed consent was waived.
Patients were included in this study if they met the following inclusion criteria: (1) pre-interventional MRI within 1 month prior to biopsy; (2) available CT- or MRI-guided liver biopsy images with documented position of biopsy needle; (3) lesion size >5 mm; (4) available pathologic specimens; (5) histologically proven HCC with atypical contrast media criteria.
Exclusion criteria were: significant artifacts on preinterventional MR images.
A total of 52 patients (10 women (19.2%), 42 men) with a mean age of 71.8 ± 9.7 years met the inclusion criteria and were included in the present study.
MRI imaging
All patients underwent MRI on a clinical 1.5-T scanner (Intera, Philips Healthcare, Hamburg, Germany). The imaging protocol included T2-weighted single-shot and turbo spin-echo sequences with and without fat suppression (TR/TE: 1600:100). Dynamic contrast-enhanced scans were obtained after administration of Gd-EOB-DTPA (0.1 mmol/kg body weight, Primovist®, Bayer HealthCare): T1 weighted gradient-echo sequences in the arterial, portal-venous and late venous phases as well as the hepatobiliary phase were taken 20 minutes after contrast media application. The sequence parameters were as follows: TR 4 ms, TE 2 ms, Matrix 172 × 172, field of view 345 × 345 mm, flip angle 10°.
Biopsies were performed under sterile conditions by using 18-G coaxial needles during clinical routine. In each case, two to three cylindrical specimens were obtained under CT- or MRI-guidance, depending on investigator preference and clinical situation.
Imaging analysis
MR images were analyzed within the clinically used PACS. Direct spatial correlation was performed with the subsequent CT- or MRI guided biopsy. The region of interest (ROI) of the pretreatment MRI was placed at the last localization of the coaxial needle. The measurement was performed by a board-certified consultant radiologist with 15 years of general experience. In 20 patients (38.4%) a second measurement was performed by a resident with 3 years of general experience to calculate the interreader agreement. Signal intensities were measured in arterial, portal venous, venous and hepatobiliary phase after 20 minutes. The ROI was placed in the phase image with a clearly visible lesion and transferred to the other sequences. A ratio was calculated for each phase divided by the native phase, as recently performed [25]. This was done to reduce heterogeneities between different MRI sequences and to provide relative tumor enhancement values. A representative patient with the measurement is shown in Figure 1 for illustration.
Figure 1.

Representative case of the patient sample with a large tumor in liver segment VII and I. A. Native T1-weighted image with hypointense signal intensity of the tumor. B. Arterial phase with peripheral contrast media uptake of the given gadoxetic acid contrast media. C. Portalvenous phase with hypointense, slight inhomogenous signal intensity of the tumor. D. Late venous phase with hypointense central signal intensity and peripheral contrast media uptake. E. Hepatobiliary phase after 20 minutes with slight inhomogeneous hypointense signal intensity of the tumor. F. Axial slice of the CT-guided biopsy with display of the biopsy system centrally within the tumor. One can appreciate a gallstone ventrally of the liver. G. HE-staining of the corresponding biopsy with 33.4 times magnification with cell nests of the hepatocellular carcinoma. H. Ki 67 staining with a moderate amount of positive tumor cells (Ki 67 index 19%).
Histological analysis
Histopathologic evaluation was performed by two experienced pathologists (D.J., K.E.) in consensus without knowledge of the patients or imaging data. Formalin-fixed, paraffin-embedded tissue serial sections (2 µm) were dewaxed in xylol and rehydrated by descending concentrations of ethanol. Standard hematoxylin and eosin (HE) staining and immunohistochemistry were performed on each specimen. For antigen detection, we used the automated immunohistochemistry slide staining system VENTANA BenchMark ULTRA (Roche Diagnostics GmbH), the VENTANA iVIEW DAB Detection Kit (Roche Diagnostics GmbH), and the indirect biotin-streptavidin method before counterstaining with Haemalaun solution. Antigen retrieval was performed with CC1mild, followed by incubation with specific primary antibodies recognizing CD45/leucocyte common antigen (polyclonal mouse antibody, clone 2B11+PD7/26; DAKO/Agilent #M0701) or Ki 67 (polyclonal mouse antibody, clone Mib1; DAKO/Agilent #M7240), at 36°C for 32 min, dilution 1:500 or 1:100, respectively. Every histopathological parameter was evaluated in five power fields (×40; 0.23 mm2 per field). Tumor-stroma ratio (TSR) was evaluated on the HE-stained specimen and percentages were given per tumor and stroma content separately. Cell density or density of tumor-infiltrating immune cells was estimated as the mean of total cell count or CD45 + leukocytes per high power field, respectively. Proliferation rate was expressed as the percentage of Ki 67-positive cells from all tumor cells (Ki 67-index). Ki 67 mean was defined as the mean of all five power fields, and Ki 67 max was the highest among the five. Histopathological evaluation was done with the Nikon ECLIPSE Ni-E microscope. According to the published literature, we used the thresholds of ≤10% immunoreactivity to define low Ki 67 expression and ≤20% [26,27].
Statistical analysis
Statistical analysis and graphics creation were performed using GraphPad Prism 8 (GraphPad Software, La Jolla, CA, USA). The collected data were evaluated using descriptive statistics (absolute and relative frequencies). Spearman’s correlation coefficient (r) was used to analyze associations between the parameters studied. The Mann-Whitney U test was used to discriminate between subgroups. Intraclass coefficients (ICC) were used to test for the interreader variability. Receiver operating characteristics (ROC) and area under the curve (AUC) were used to test for diagnostic accuracy. In all cases, p-values <0.05 were used to indicate statistical significance.
Results
In all cases, the atypical liver lesion was histologically proven to be HCC. Per high-power field, the mean values of histological parameters were as follows: tumor-stroma ratio was 17.1 ± 20, cell count was 147.0 ± 60.3, CD45 was 7.3 ± 8.0, and Ki 67 max was 16.9 ± 16.5.
Interreader agreement
Interreader agreement was excellent for all MRI signal intensities studied. The ICC was 0.95 (95% CI 0.89-0.99) for the arterial phase, 0.83 (95% CI 0.80-0.89) for the portal venous phase, 0.94 (95% CI 0.90-0.99) for the venous phase, and 0.97 (95% CI 0.95-0.99) for the hepatobiliary phase.
Correlation analysis
The results of the correlation analysis are summarized in Table 1. There were no statistically significant correlations between MRI signal intensities and cell count, tumor-stroma ratio and CD45 count. Only a moderate inverse correlation was observed between relative signal intensities of the arterial phase with Ki 67 max (r=-0.41, P=0.002) and with Ki 67 mean (r=-0.37, P=0.005). The corresponding graphs are shown in Figure 2.
Table 1.
Correlation analysis between relative MRI signal intensities and the investigated histopathological parameters
| Relative MRI signal intensity | Tumor-stroma ratio | CD45 | Cell count | Ki 67 mean | Ki 67 max |
|---|---|---|---|---|---|
| Arterial phase relative SI | r=0.12 (P=0.39) | r=0.18 (P=0.18) | r=0.05 (P=0.19) | r=-0.37 (P=0.005) | r=-0.41 (P=0.002) |
| Portalvenous phase relative SI | r=0.08 (P=0.56) | r=0.18 (P=0.21) | r=-0.08 (P=0.55) | r=-0.24 (P=0.08) | r=-0.25 (P=0.07) |
| Venous phase relative SI | r=0.13 (P=0.35) | r=0.22 (P=0.11) | r=-0.05 (P=0.69) | r=-0.25 (P=0.07) | r=-0.22 (P=0.11) |
| Hepatobiliary phase relative SI | r=0.14 (P=0.31) | r=0.21 (P=0.13) | r=0.16 (P=0.26) | r=-0.12 (P=0.38) | r=-0.05 (P=0.71) |
Statistically significant correlations are highlighted in bold. Abbreviations: MRI, magnetic resonance imaging; SI, signal intensity.
Figure 2.
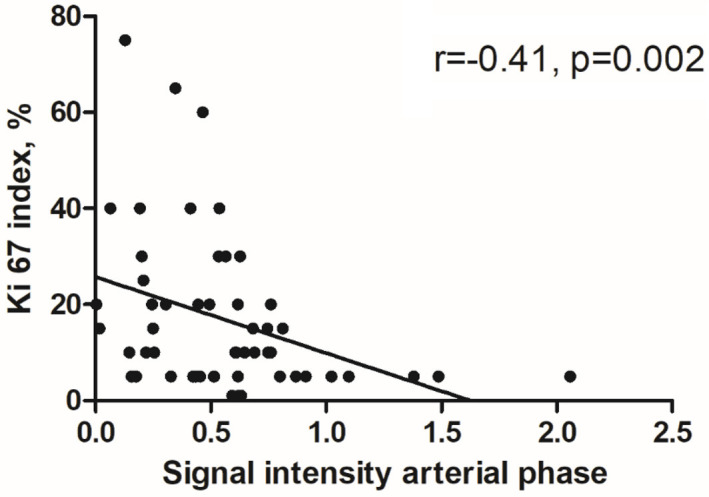
Spearman’s correlation analysis demonstrating the moderate inverse correlation between the signal intensities of the arterial phase with Ki 67 index (r=-0.41, P=0.002).
Discrimination analysis
The results of the discrimination analysis for high versus low proliferating HCC are shown in Table 2. For both thresholds of ≤20% and ≤10% the signal intensity of the hepatobiliary phase was statistically significantly different with a p-value of 0.01 and 0.02, respectively. The corresponding graphs are shown in Figure 3. No differences were observed between the groups for the other phases.
Table 2.
Discrimination analysis between high and low proliferative HCC employing the threshold value of 20% and 10%
| Parameter | High proliferative HCC>20% (n=12) | Low proliferative HCC≤20% (n=41) | p-values | High proliferative HCC>10% (n=24) | Low proliferative HCC≤10% (n=29) | p-values |
|---|---|---|---|---|---|---|
| Arterial phase relative SI | 0.48 ± 0.29 | 0.57 ± 0.39 | 0.54 | 0.50 ± 0.29 | 0.59 ± 0.43 | 0.57 |
| Portalvenous phase relative SI | 0.67 ± 0.25 | 0.68 ± 0.38 | 0.90 | 0.67 ± 0.28 | 0.68 ± 0.40 | 0.57 |
| Venous phase relative SI | 0.63 ± 0.19 | 0.60 ± 0.30 | 0.37 | 0.61 ± 0.26 | 0.60 ± 0.30 | 0.33 |
| Hepatobiliary phase relative SI | 0.61 ± 0.38 | 0.29 ± 0.38 | 0.01 | 0.48 ± 0.37 | 0.27 ± 0.41 | 0.02 |
Statistically significant results are highlighted in bold. Abbreviations: MRI, magnetic resonance imaging; SI, signal intensity.
Figure 3.

Scatter plots of the discrimination analysis of high versus low proliferating HCC using the threshold value of ≤20% (A) and ≤10% (B). The hepatobiliary phase signal intensity was statistically higher in high proliferative tumors compared to low proliferative ones (P=0.01 and P=0.02, respectively).
Regarding the threshold value of ≤20%, the resulting AUC for the signal intensity of the hepatobiliary phase was 0.73 (95% CI 0.59-0.87) with a sensitivity of 70.7 and a specificity of 75.0 using the threshold value of 0.47. Using the threshold value of ≤10%, the resulting AUC for the signal intensity of the hepatobiliary phase was 0.67 (95% CI 0.53-0.82) with a sensitivity of 65.5 and a specificity of 70.8 using the threshold value of 0.26.
Discussion
The present study evaluated the associations between the direct prebioptic dynamic contrast-enhanced MRI and the biopsy specimen in patients with atypical HCC. One key aspect of the present study was the exact co-registration between the prebioptic imaging and the performed biopsy. With this approach, there is a high degree of confidence that the histopathological evaluation and the imaging phenotype can be evaluated together.
There is no doubt that contrast-enhanced imaging can reflect the tumor biology in HCC [28,29]. The imaging hallmarks of HCC is the hypervascularization in the arterial phase and the portal venous washout [2]. These two imaging findings are sufficient to diagnose HCC without histopathological confirmation. However, this can only be detected in 40-50% of HCC patients, and biopsy and histopathology are required in the remaining patients [2]. The present cohort represents the so-called atypical HCC [30] with the diagnostic need for biopsy to confirm the diagnosis and to plan the patient’s treatment.
The imaging characteristics reflect the malignant behavior of HCC. Therefore, it seems plausible that the dynamic contrast-enhanced MRI used in the present study should also be able to reflect the investigated histopathological parameters investigated in HCC [28].
The histopathological parameters examined in the present study include proliferation, cellularity, tumor-infiltrating lymphocytes and the tumor-stroma ratio. All of these are prognostic and predictive features of a malignant tumor. It would be critical to clinical care, if imaging could reflect and even predict these parameters, potentially reducing the need for biopsy. This could also lead to a reduction in biopsy-related complications and thus be of potential benefit to patient care.
The Ki 67 index is a prognostic biomarker in several tumor entities and has also been evaluated in HCC patients [26,27,31-35]. For example, it was a prognostic factor for overall survival in patients undergoing radiofrequency ablation [31]. It was also an independent factor for HCC recurrence after liver transplantation [32]. Interestingly, atypical hepatocytes may also express higher Ki 67 and are associated with tumor recurrence when identified in non-cancerous tissue [35].
The main finding of the present study is the association between arterial phase signal intensity and the proliferation potential Ki 67 index. This is particularly important because all HCC tumors were of an atypical non-hypervascularized nature and therefore had a non-specific imaging characteristic in the arterial phase. This may indicate that the quantified signal intensities have prognostic relevance despite their non-specific characteristics in the qualitative reading by the radiologist. Not only the arterial phase is associated with the Ki 67 index, the signal intensities of the hepatobiliary phase were different between low and high proliferative tumors in our cohort.
These results may support a recent Chinese study that used T1 mapping of the hepatobiliary phase to predict the Ki 67 index [20]. The authors demonstrated that a T1-relation time >705 msec is an independent predictor of the Ki 67 index [20]. Another research group investigated the signal intensity of the hepatobiliary phase in 103 HCC patients and demonstrated statistically significant results between high expressing tumors and low expressing tumors using a threshold value of 10% Ki 67 positive cells [36].
The Chinese group of Huang et al. used the dynamic contrast-enhanced ultrasonography and showed that the group with high Ki 67 had a correspondingly higher fall time and peak energy of the contrast media curve compared to the low-expressing group [26]. Wu et al. used a radiomics signature based on CT images to predict Ki 67 status with a promising diagnostic accuracy of 0.77 to 0.836 AUC [37]. However, these studies did not evaluate the exact spatial localization to ensure the best agreement between imaging and histopathology. In addition, it must be considered that there are distinct imaging differences among HCC subtypes that need to be accounted for and for which imaging phenotypes have only been investigated in preliminary studies [21]. Furthermore, there are biological differences between Asian and European HCC cohorts in terms of etiology and resulting imaging phenotype [37-39].
To our knowledge there are no reports regarding differences in Ki 67 expression according to the typical HCC or atypical HCC contrast media pattern. However, this is beyond the present study design as typical HCC are not recommended for biopsy [2] and therefore could not be evaluated in our patient sample.
In discrimination analysis, the hepatobiliary phase performed best in identifying highly proliferative HCC tumors. This is another important aspect of the prognostic relevance of the hepatobiliary phase as it can be considered as a functional imaging sequence [40]. The intracellular uptake of the contrast media is reflected by the measurement used in the present study and is mainly associated with the beta-catenin mutation in HCC [21]. In a large study, relative enhancement of the hepatobiliary phase was an independent prognostic marker for worse survival in HCC patients receiving sorafenib therapy (HR 1.7 [95% CI 1.21-2.3], P=0.002) [25].
We could not identify an association with cellularity, tumor-infiltrating lymphocytes and tumor-stroma ratio. Presumably, these features are better reflected by diffusion-weighted imaging, which is superior in predicting tumor microstructure and cellularity [13,14]. This was also shown in a comprehensive meta- analysis for HCC patients [41].
The present study is not free from limitations. First, it is a retrospective study with known inherent shortcomings. To overcome some bias, imaging and histopathological assessment were performed blinded to each other. Second, because of the recommendation only to biopsy atypical HCC [2], we cannot provide data regarding typical HCC with the hallmarks of arterial hypervascularization and portal venous washout phenomenon.
Conclusion
DCE-MRI is associated with the Ki 67 index and therefore with proliferation potential in atypical HCC. The hepatobiliary phase could discriminate HCCs according to their Ki 67 index. Quantitative MRI could be used as an imaging-based surrogate for proliferative HCC. Further studies are needed to validate the present results.
Disclosure of conflict of interest
None.
Abbreviations
- CT
Computed tomography
- MRI
magnetic resonance imaging
- HCC
hepatocellular carcinoma
- ROI
region of interest
- AUC
area under the curve
- ROC
receiver operating characteristics
- ICC
intraclass coefficient
References
- 1.Ariff B, Lloyd CR, Khan S, Shariff M, Thillainayagam AV, Bansi DS, Khan SA, Taylor-Robinson SD, Lim AK. Imaging of liver cancer. World J Gastroenterol. 2009;15:1289–1300. doi: 10.3748/wjg.15.1289. [DOI] [PMC free article] [PubMed] [Google Scholar]
- 2.Llovet JM, Burroughs A, Bruix J. Hepatocellular carcinoma. Lancet. 2003;362:1907–1917. doi: 10.1016/S0140-6736(03)14964-1. [DOI] [PubMed] [Google Scholar]
- 3.McGlynn KA, Petrick JL, El-Serag HB. Epidemiology of hepatocellular carcinoma. Hepatology. 2021;73(Suppl 1):4–13. doi: 10.1002/hep.31288. [DOI] [PMC free article] [PubMed] [Google Scholar]
- 4.Haj-Mirzaian A, Kadivar A, Kamel IR, Zaheer A. Updates on imaging of liver tumors. Curr Oncol Rep. 2020;22:46. doi: 10.1007/s11912-020-00907-w. [DOI] [PubMed] [Google Scholar]
- 5.Piccinino F, Sagnelli E, Pasquale G, Giusti G. Complications following percutaneous liver biopsy. A multicentre retrospective study on 68,276 biopsies. J Hepatol. 1986;2:165–173. doi: 10.1016/s0168-8278(86)80075-7. [DOI] [PubMed] [Google Scholar]
- 6.Neuberger J, Patel J, Caldwell H, Davies S, Hebditch V, Hollywood C, Hubscher S, Karkhanis S, Lester W, Roslund N, West R, Wyatt JI, Heydtmann M. Guidelines on the use of liver biopsy in clinical practice from the British Society of Gastroenterology, the Royal College of Radiologists and the Royal College of Pathology. Gut. 2020;69:1382–1403. doi: 10.1136/gutjnl-2020-321299. [DOI] [PMC free article] [PubMed] [Google Scholar]
- 7.McGill DB, Rakela J, Zinsmeister AR, Ott BJ. A 21-year experience with major hemorrhage after percutaneous liver biopsy. Gastroenterology. 1990;99:1396–1400. doi: 10.1016/0016-5085(90)91167-5. [DOI] [PubMed] [Google Scholar]
- 8.Lambin P, Rios-Velazquez E, Leijenaar R, Carvalho S, van Stiphout RG, Granton P, Zegers CM, Gillies R, Boellard R, Dekker A, Aerts HJ. Radiomics: extracting more information from medical images using advanced feature analysis. Eur J Cancer. 2012;48:441–446. doi: 10.1016/j.ejca.2011.11.036. [DOI] [PMC free article] [PubMed] [Google Scholar]
- 9.Aerts HJ, Velazquez ER, Leijenaar RT, Parmar C, Grossmann P, Carvalho S, Bussink J, Monshouwer R, Haibe-Kains B, Rietveld D, Hoebers F, Rietbergen MM, Leemans CR, Dekker A, Quackenbush J, Gillies RJ, Lambin P. Decoding tumour phenotype by noninvasive imaging using a quantitative radiomics approach. Nat Commun. 2014;5:4006. doi: 10.1038/ncomms5006. [DOI] [PMC free article] [PubMed] [Google Scholar]
- 10.Incoronato M, Aiello M, Infante T, Cavaliere C, Grimaldi AM, Mirabelli P, Monti S, Salvatore M. Radiogenomic analysis of oncological data: a technical survey. Int J Mol Sci. 2017;18:805. doi: 10.3390/ijms18040805. [DOI] [PMC free article] [PubMed] [Google Scholar]
- 11.Meyer HJ, Hamerla G, Höhn AK, Surov A. CT texture analysis-correlations with histopathology parameters in head and neck squamous cell carcinomas. Front Oncol. 2019;9:444. doi: 10.3389/fonc.2019.00444. [DOI] [PMC free article] [PubMed] [Google Scholar]
- 12.Just N. Improving tumour heterogeneity MRI assessment with histograms. Br J Cancer. 2014;111:2205–2213. doi: 10.1038/bjc.2014.512. [DOI] [PMC free article] [PubMed] [Google Scholar]
- 13.Surov A, Meyer HJ, Wienke A. Associations between apparent diffusion coefficient (ADC) and Ki 67 in different tumors: a meta-analysis. Part 1: ADCmean . Oncotarget. 2017;8:75434–75444. doi: 10.18632/oncotarget.20406. [DOI] [PMC free article] [PubMed] [Google Scholar]
- 14.Surov A, Meyer HJ, Wienke A. Correlation between apparent diffusion coefficient (ADC) and cellularity is different in several tumors: a meta-analysis. Oncotarget. 2017;8:59492–59499. doi: 10.18632/oncotarget.17752. [DOI] [PMC free article] [PubMed] [Google Scholar]
- 15.Yang WL, Zhu F, Chen WX. Texture analysis of contrast-enhanced magnetic resonance imaging predicts microvascular invasion in hepatocellular carcinoma. Eur J Radiol. 2022;156:110528. doi: 10.1016/j.ejrad.2022.110528. [DOI] [PubMed] [Google Scholar]
- 16.Meyer HJ, Hohn AK, Prasse G, Hoffmann KT, Surov A. Associations between ADC texture analysis and tumor infiltrating lymphocytes in brain metastasis - a preliminary study. Anticancer Res. 2021;41:4549–4554. doi: 10.21873/anticanres.15267. [DOI] [PubMed] [Google Scholar]
- 17.Holli-Helenius K, Salminen A, Rinta-Kiikka I, Koskivuo I, Brück N, Boström P, Parkkola R. MRI texture analysis in differentiating luminal A and luminal B breast cancer molecular subtypes - a feasibility study. BMC Med Imaging. 2017;17:69. doi: 10.1186/s12880-017-0239-z. [DOI] [PMC free article] [PubMed] [Google Scholar]
- 18.Marrero JA, Kulik LM, Sirlin CB, Zhu AX, Finn RS, Abecassis MM, Roberts LR, Heimbach JK. Diagnosis, staging, and management of hepatocellular carcinoma: 2018 Practice Guidance by the American Association for the Study of Liver Diseases. Hepatology. 2018;68:723–750. doi: 10.1002/hep.29913. [DOI] [PubMed] [Google Scholar]
- 19.Surov A, Eger KI, Potratz J, Gottschling S, Wienke A, Jechorek D. Apparent diffusion coefficient correlates with different histopa-thological features in several intrahepatic tumors. Eur Radiol. 2023;33:5955–5964. doi: 10.1007/s00330-023-09788-6. [DOI] [PMC free article] [PubMed] [Google Scholar]
- 20.Qiu G, Chen J, Liao W, Liu Y, Wen Z, Zhao Y. Gadoxetic acid-enhanced MRI combined with T1 mapping and clinical factors to predict Ki-67 expression of hepatocellular carcinoma. Front Oncol. 2023;13:1134646. doi: 10.3389/fonc.2023.1134646. [DOI] [PMC free article] [PubMed] [Google Scholar]
- 21.Auer TA, Halskov S, Fehrenbach U, Nevermann NF, Pelzer U, Mohr R, Hamm B, Schöning W, Horst D, Ihlow J, Geisel D. Gd-EOB MRI for HCC subtype differentiation in a western population according to the 5th edition of the World Health Organization classification. Eur Radiol. 2023;33:6902–6915. doi: 10.1007/s00330-023-09669-y. [DOI] [PMC free article] [PubMed] [Google Scholar]
- 22.Jeon Y, Kwon SM, Rhee H, Yoo JE, Chung T, Woo HG, Park YN. Molecular and radiopathologic spectrum between HCC and intrahepatic cholangiocarcinoma. Hepatology. 2023;77:92–108. doi: 10.1002/hep.32397. [DOI] [PubMed] [Google Scholar]
- 23.Li K, Zhang R, Wen F, Zhao Y, Meng F, Li Q, Hao A, Yang B, Lu Z, Cui Y, Zhou M. Single-cell dissection of the multicellular ecosystem and molecular features underlying microvascular invasion in HCC. Hepatology. 2024;79:1293–1309. doi: 10.1097/HEP.0000000000000673. [DOI] [PMC free article] [PubMed] [Google Scholar]
- 24.Bao Y, Li JX, Zhou P, Tong Y, Wang LZ, Chang DH, Cai WW, Wen L, Liu J, Xiao YD. Identifying proliferative hepatocellular carcinoma at pretreatment CT: implications for therapeutic outcomes after transarterial chemoembolization. Radiology. 2023;308:e230457. doi: 10.1148/radiol.230457. [DOI] [PubMed] [Google Scholar]
- 25.Öcal O, Rössler D, Gasbarrini A, Berg T, Klümpen HJ, Bargellini I, Peynircioglu B, van Delden O, Schulz C, Schütte K, Iezzi R, Pech M, Malfertheiner P, Sangro B, Ricke J, Seidensticker M. Gadoxetic acid uptake as a molecular imaging biomarker for sorafenib resistance in patients with hepatocellular carcinoma: a post hoc analysis of the SORAMIC trial. J Cancer Res Clin Oncol. 2022;148:2487–2496. doi: 10.1007/s00432-021-03803-3. [DOI] [PMC free article] [PubMed] [Google Scholar]
- 26.Huang Z, Zhou P, Li S, Li K. Prediction of the Ki-67 marker index in hepatocellular carcinoma based on Dynamic Contrast-Enhanced Ultrasonography with Sonazoid. Insights Imaging. 2022;13:199. doi: 10.1186/s13244-022-01320-6. [DOI] [PMC free article] [PubMed] [Google Scholar]
- 27.Luo Y, Ren F, Liu Y, Shi Z, Tan Z, Xiong H, Dang Y, Chen G. Clinicopathological and prognostic significance of high Ki-67 labeling index in hepatocellular carcinoma patients: a meta-analysis. Int J Clin Exp Med. 2015;8:10235–10247. [PMC free article] [PubMed] [Google Scholar]
- 28.Wang B, Gao ZQ, Yan X. Correlative study of angiogenesis and dynamic contrast-enhanced magnetic resonance imaging features of hepatocellular carcinoma. Acta Radiol. 2005;46:353–358. doi: 10.1080/02841850510021247. [DOI] [PubMed] [Google Scholar]
- 29.Boal Carvalho P, Pereira E. Imagiological diagnosis of gastrointestinal diseases - diagnostic criteria of hepatocellular carcinoma. GE Port J Gastroenterol. 2015;22:153–160. doi: 10.1016/j.jpge.2015.04.002. [DOI] [PMC free article] [PubMed] [Google Scholar]
- 30.Ricke J, Steffen IG, Bargellini I, Berg T, Bilbao Jaureguizar JI, Gebauer B, Iezzi R, Loewe C, Karçaaltincaba M, Pech M, Sengel C, van Delden O, Vandecaveye V, Zech CJ, Seidensticker M. Gadoxetic acid-based hepatobiliary MRI in hepatocellular carcinoma. JHEP Rep. 2020;2:100173. doi: 10.1016/j.jhepr.2020.100173. [DOI] [PMC free article] [PubMed] [Google Scholar]
- 31.Yang C, Su H, Liao X, Han C, Yu T, Zhu G, Wang X, Winkler CA, O’Brien SJ, Peng T. Marker of proliferation Ki-67 expression is associated with transforming growth factor beta 1 and can predict the prognosis of patients with hepatic B virus-related hepatocellular carcinoma. Cancer Manag Res. 2018;10:679–696. doi: 10.2147/CMAR.S162595. [DOI] [PMC free article] [PubMed] [Google Scholar]
- 32.Sofocleous CT, Garg S, Petrovic LM, Gonen M, Petre EN, Klimstra DS, Solomon SB, Brown KT, Brody LA, Covey AM, Dematteo RP, Schwartz L, Kemeny NE. Ki-67 is a prognostic biomarker of survival after radiofrequency ablation of liver malignancies. Ann Surg Oncol. 2012;19:4262–4269. doi: 10.1245/s10434-012-2461-9. [DOI] [PMC free article] [PubMed] [Google Scholar]
- 33.Guzman G, Alagiozian-Angelova V, Layden-Almer JE, Layden TJ, Testa G, Benedetti E, Kajdacsy-Balla A, Cotler SJ. p53, Ki-67, and serum alpha feto-protein as predictors of hepatocellular carcinoma recurrence in liver transplant patients. Mod Pathol. 2005;18:1498–1503. doi: 10.1038/modpathol.3800458. [DOI] [PubMed] [Google Scholar]
- 34.Moriyama M, Kanda T, Midorikawa Y, Matsumura H, Masuzaki R, Nakamura H, Ogawa M, Matsuoka S, Shibata T, Yamazaki M, Kuroda K, Nakayama H, Higaki T, Kanemaru K, Miki T, Sugitani M, Takayama T. The proliferation of atypical hepatocytes and CDT1 expression in noncancerous tissue are associated with the postoperative recurrence of hepatocellular carcinoma. Sci Rep. 2022;12:20508. doi: 10.1038/s41598-022-25201-6. [DOI] [PMC free article] [PubMed] [Google Scholar]
- 35.Ye Z, Cao L, Wei Y, Chen J, Zhang Z, Yao S, Duan T, Song B. Preoperative prediction of hepatocellular carcinoma with highly aggressive characteristics using quantitative parameters derived from hepatobiliary phase MR images. Ann Transl Med. 2020;8:85. doi: 10.21037/atm.2020.01.04. [DOI] [PMC free article] [PubMed] [Google Scholar]
- 36.Wu H, Han X, Wang Z, Mo L, Liu W, Guo Y, Wei X, Jiang X. Prediction of the Ki-67 marker index in hepatocellular carcinoma based on CT radiomics features. Phys Med Biol. 2020;65:235048. doi: 10.1088/1361-6560/abac9c. [DOI] [PubMed] [Google Scholar]
- 37.Kaya NA, Chen J, Lai H, Yang H, Ma L, Liu X, Alvarez JS, Liu J, Hillmer AM, Tai D, Sheng JYP, Hu Z, Chan YS, Chow PKH, Mu Y, Wuestefeld T, Zhai W. Genome instability is associated with ethnic differences between Asians and Europeans in hepatocellular carcinoma. Theranostics. 2022;12:4703–4717. doi: 10.7150/thno.71676. [DOI] [PMC free article] [PubMed] [Google Scholar]
- 38.Carr BI, Pancoska P, Giannini EG, Farinati F, Ciccarese F, Rapaccini GL, Marco MD, Benvegnù L, Zoli M, Borzio F, Caturelli E, Chiaramonte M, Trevisani F Italian Liver Cancer (ITA.LI.CA) group. Identification of two clinical hepatocellular carcinoma patient phenotypes from results of standard screening parameters. Semin Oncol. 2014;41:406–414. doi: 10.1053/j.seminoncol.2014.04.002. [DOI] [PMC free article] [PubMed] [Google Scholar]
- 39.Fong ZV, Tanabe KK. The clinical management of hepatocellular carcinoma in the United States, Europe, and Asia: a comprehensive and evidence-based comparison and review. Cancer. 2014;120:2824–2838. doi: 10.1002/cncr.28730. [DOI] [PubMed] [Google Scholar]
- 40.Bastati N, Beer L, Ba-Ssalamah A, Poetter-Lang S, Ambros R, Kristic A, Lauber D, Pomej K, Binter T, Simbrunner B, Semmler G, Balcar L, Bican Y, Hodge JC, Wrba T, Trauner M, Reiberger T, Mandorfer M. Gadoxetic acid-enhanced MRI-derived functional liver imaging score (FLIS) and spleen diameter predict outcomes in ACLD. J Hepatol. 2022;77:1005–1013. doi: 10.1016/j.jhep.2022.04.032. [DOI] [PubMed] [Google Scholar]
- 41.Surov A, Pech M, Omari J, Fischbach F, Damm R, Fischbach K, Powerski M, Relja B, Wienke A. Diffusion-weighted imaging reflects tumor grading and microvascular invasion in hepatocellular carcinoma. Liver Cancer. 2021;10:10–24. doi: 10.1159/000511384. [DOI] [PMC free article] [PubMed] [Google Scholar]