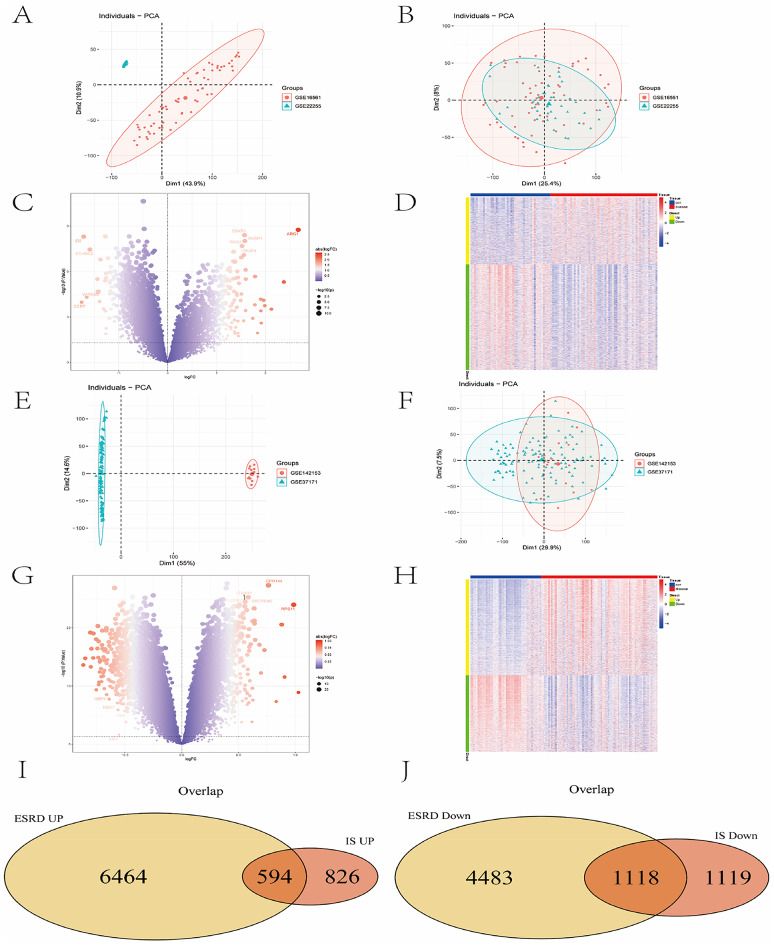
Fig. 1.
PCA correction and differential expression analysis. (A) PCA plot of IS datasets (GSE16561 and GSE22255) before Combat correction. (B) PCA plot of IS datasets after Combat correction. (C) Volcano plot of IS differential expression analysis. 3657 DEGs identified (1420 upregulated, 2237 downregulated. (D) Heatmap of top 50 DEGs in IS. Yellow: high expression; green: low expression. (E) PCA plot of ESRD datasets (GSE37171 and GSE142153) before Combat correction. (F) PCA plot of ESRD datasets after Combat correction. (G) Volcano plot of ESRD differential expression analysis. 12659 DEGs identified (7058 upregulated, 5601 downregulated). (H) Heatmap of top 50 DEGs in ESRD. (I) Venn diagram of shared upregulated DEGs between IS and ESRD (594 genes). (J) Venn diagram of shared downregulated DEGs between IS and ESRD (1118 genes).

