

Abstract
Recently, the incidence and mortality of heat stroke (HS) have risen catastrophically. However, postmortem diagnosis of HS is challenging owing to the lack of characteristic morphological markers. Liver damage can often serve as a direct cause of death in HS. Therefore, this study aimed to identify protein biomarkers in the liver and to evaluate their utility as diagnostic biomarkers for HS. The morphological and biochemical tests of HS rats models revealed hydropic degeneration, hepatocyte necrosis, and impaired liver function. 283 differentially expressed proteins between the HS and control groups were screened by proteomic analysis. Subsequently, HSPA4, GGCX, and CYP2B6 were selected as candidate biomarkers based on Proteomic results, Western blotting and immunohistochemistry results in HS rats. These three candidate biomarkers were further validated as diagnostic protein biomarkers for HS death based on the immunohistochemistry results of 29 human cases. Finally, receiver operating characteristic analysis indicated that the combination of HSPA4, GGCX and CYP2B6 provided optimal diagnostic efficacy for HS, with an area under the curve of over 0.999. In conclusion, we propose that the integrating morphological findings, liver function analysis, and protein biomarkers (HSPA4, GGCX, and CYP2B6) in liver could be used for HS diagnosis in forensic practices.
Keywords: Heat stroke, Biomarkers, Proteomics, Liver damage, Postmortem diagnosis
Subject terms: Proteomics, Biomarkers, Diagnostic markers, Liver
Introduction
Heat stroke (HS) is a fatal clinical syndrome characterized by an imbalance in body temperature regulation (core body temperature above 40 °C), water-electrolytes disorders, central nervous system failure, and multi-organ dysfunction syndrome1. With an increasing frequency of global heatwaves and extreme weather in summer, the incidence of HS ranges approximately from 17.6 to 26.5 per 100,000 people, with the mortality of hospitalized HS patients being nearly 14%–65%2,3.
HS caused death involved workers’ compensation, insurance claims, physical abuse, and even differential diagnosis with some sudden unexpected deaths in forensic practice. The postmortem diagnosis of fatal HS requires a comprehensive evaluation based on the premortem clinical presentation of the deceased, autopsy findings, and scene environmental conditions, and most importantly, to exclude other possible causes of death4. The postmortem body died from HS include early and prominent dark-red livor mortis, clumping of red blood cells within blood vessels, skeletal muscle damage, and neuronal cell necrosis (particularly Purkinje cells of the cerebellum). However, all external and internal examinations are non-specific, indistinct, and easily omitted without detailed case information1,5. Recently, some scholars have attempted to study potential markers for the postmortem diagnosis of HS, including biochemical investigations4,6,7, immunohistochemistry (IHC)8,9, and Fourier transform infrared spectroscopy10, which have been inconclusive and not applied in forensic practice till now. Therefore, it is imperative to identify reliable and feasible biomarkers for postmortem diagnosis of HS.
Liver damage typically occurs earlier and is a common complication in HS, often serving as a direct cause of death11,12. The renal-hepatic phase is typically regarded as the terminal stage of HS1. Liver damage might be related to the entry of endotoxins from the gastrointestinal tract, which is the key mechanism of HS (Endotoxinemia theory)11,13,14. Severe HS-induced liver injury has been reported to result in a mortality rate > 70%15,16. Furthermore, liver tissue, as an abundant soft tissue, can be relatively well-preserved during the postmortem period, even during putrefaction, and is frequently used for toxicological analysis in forensic investigations. These preponderances highlight liver tissue as a promising candidate sample for identifying biomarkers to aid in the postmortem diagnosis of fatal HS.
Proteins, as the primary executors of biological activities, often change prior to morphological alterations and can be relatively easily tested postmortem through IHC assays on paraffin-embedded slides over extended periods. Various multi-organ dysfunctions in patients with HS before death are closely related to abnormal protein expression and activity10. Therefore, protein indicators hold enormous potential for the identification of death due to HS. Additionally, proteomics—owing to its versatility and high throughput capabilities—has emerged as a powerful tool for screening potential protein biomarkers and investigating the underlying pathophysiological mechanisms of HS17.
In this study, we aimed to identify potential protein biomarkers in liver for the postmortem diagnosis of HS through histopathological examinations, proteomics analysis, western blot, and IHC tests from both animal models and human cases.
Results
The liver morphology and function of HS rats
The core temperature (Tcs) of all HS group rats reached 42.3 °C ± 0.13 °C. Additionally, all HS rats exhibited clinical symptoms such as profuse sweating, delayed response to external stimuli, and convulsions. Morphological examinations of the liver tissue from HS revealed focal hepatocyte hydropic degeneration, hepatocyte necrosis, and hemorrhage (Fig. 1a). Compared to the control group, serum biochemical tests showed significantly elevated values of Alanine Transaminase (ALT), Aspartate Aminotransferase (AST), and the AST/ALT ratio in the HS group (Fig. 1b), with no difference in serum total bilirubin (TBIL), indicating that HS caused hepatocyte injury rather than biliary tract injury.
Fig. 1.

Morphological and functional changes in liver of HS rats. (a)Representative images of liver histology with HE staining in HS and control rats (100 ×, Bar: 200 μm). The HS group showed focal hepatocyte hydropic degeneration (yellow arrow), hepatocyte necrosis (red arrow), and focal hemorrhage (green arrow). (b)Results of serum biochemical assay of liver function in HS rats, *p < 0.05, ***p < 0.001, ns: No significance. ALT: Alanine Transaminase, AST: Aspartate Aminotransferase, TBIL: serum total bilirubin.
Proteomics analysis
Protein profiles were screened using Tandem Mass Tag (TMT)-based quantitative proteomic analysis to identify significantly different proteins (upregulated or downregulated) in HS. A total of 8154 proteins (Table S1) were identified and filtered from the original dataset. Additionally, Q-value (adjusted p-value) < 0.05 and | Log2 Fold change(FC) |> 1 were criteria to screen out the differentially expressed proteins (DEPs). A total of 283 DEPs were identified in the HS group compared to the control group, including 174 up-regulated DEPs and 109 down-regulated DEPs. The volcano plot of DEPs was shown in Fig. 2. Detailed information about all 283 DEPs was provided in Table S2. The subcellular localization analysis, Gene oncologe (GO) enrichment analysis and Kyoto Encyclopedia of Genes and Genomes (KEGG) enrichment analysis were conducted to explore the functional features and biological information of the DEPs in HS.
Fig. 2.
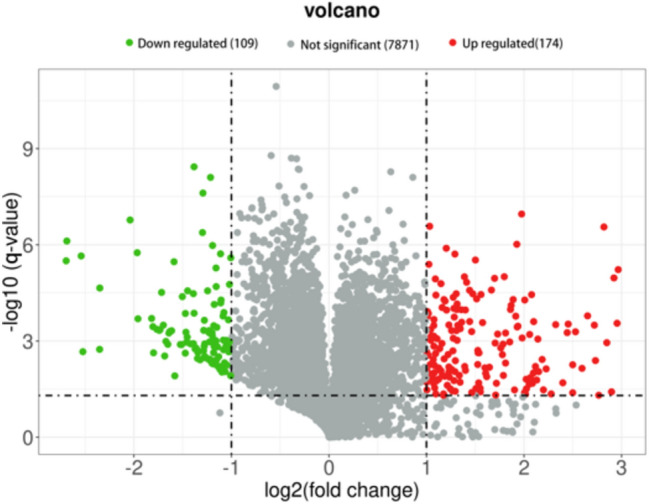
Volcano plot of 283 shared DEPs in the HS group. Red dots: up-regulated proteins, green dots: down-regulated proteins, Gray dots: proteins with no significant differences. This figure illustrated the differences in protein expression levels between the HS group and control group. The criteria for screening up-regulated and down-regulated proteins are a | Log2 Fold change(FC) |> 1 and.
The subcellular localization analysis of all DEPs identified in the livers of HS death indicated that they were primarily distributed in the nucleus (n = 90), cytoplasm (n = 70), extracell (n = 49), and plasma membrane (n = 36). Additionally, DEPs localized to the mitochondria were also identified (n = 21). Based on these results (Fig. 3), it can be inferred that under the heat stress conditions, the body primarily affects key proteins in critical structures such as the nucleus and cell membrane, disrupting their normal conformation and function.
Fig. 3.

The subcellular localization map of 283 DEPs in HS.
GO annotation analysis of the DEPs demonstrated their specific distribution in key biological processes (BP), cellular components (CC), and molecular functions (MF). The most enriched terms in BP included cellular processes, biological regulation, metabolic processes, and responses to stimuli. In terms of CC, the most enriched categories were related to cells, organelles, and membranes. For MF, the enriched terms were primarily associated with binding, catalytic activity, and molecular function (Fig. 4a). These results reflect the liver’s response to the HS.
Fig. 4.

Mechanisms of HS through proteomic analysis. (a)GO enrichment of DEPs. (b)The KEGG pathway categories in all DEPs. (c)The top 20 enriched KEGG pathways of DEPs in the HS.
As shown in Fig. 4b, KEGG enrichment revealed that the DEPs were primarily enriched in pathways associated with signal transduction, lipid metabolism, immune system, infectious diseases, and cell growth and death. Furthermore, KEGG pathway analysis identified inflammatory and coagulation-related disordes, arachidonic acid metabolism, and the Hippo signaling pathway as important pathways involved in HS (Fig. 4c), implying that inflammation stimulation, oxidative stress, and coagulation dysfunction may play significant role in the pathophysiology of HS.
Selection and determination of candidate biomarkers for HS
To identify potential biomarkers for the postmortem diagnosis of HS, DEPs were selected based on the following strict criteria: First, DEPs were selected based on |log2 FC|> 1, a q-value < 0.05. Second, DEPs with higher |log2 FC| values were given higher priority for inclusion. Third, selected DEPs that exhibit homology in both animal and human samples to enhance the cross-species applicability of markers. Fourth, utilizing the Human Protein Atlas and the Uniprot to select DEPs specifically (or highly) expressed in the liver tissue or closely related to the liver tissue. Based on the above screening criteria, five DEPs (RASA4, HSPA4, GGCX, CYP2B6 and SERPINA3C) were selected as HS candidate protein biomarkers for further validation.
Western blotting (WB) and IHC were subsequently performed to verify the candidate protein markers in HS rats screened by proteomics results. In comparison with the control group, the HS group exhibited a decreased expression level of HSPA4(P < 0.01), while the expression levels of GGCX and CYP2B6 were approximately 1.5-fold (P < 0.01) and twofold (P < 0.001) higher, respectively (Fig. 5a, 5b). The original WB images were shown in in Supplementary material 1. Consistent with the WB results, IHC showed that the staining intensity of HSPA4 was relatively weaker, whereas the staining intensities of GGCX and CYP2B6 were significantly stronger in HS group compared to the control group (Fig. 5c, 5 d). In contrast, the remaining two proteins, RASA4 and SERPINA3 C, showed no differences in expression levels between the HS and control groups, as assessed by both WB and IHC staining in rats.
Fig. 5.


The expression validation of candidate protein biomarkers in rats liver. (a)WB results of selected 5 DEPs in rats (GAPDH and β-Actin were used as the loading control). (b)Relative expression of selected 5 DEPs in HS group compared to that in the control group (**: P ≤ 0.01; ****: P ≤ 0.0001; ns: no significance). (c) Representative image of IHC staining of the selected 5 DEPs in the HS group and control group rats (200 ×, Bar: 100 μm; 400 ×, Bar: 50 μm). (d) Statistical analysis of mean density values for the IHC staining between HS group and control group. (**: P ≤ 0.01; *:P ≤ 0.05; ns: no significance).
Validation of candidate protein biomarkers in human autopsy cases
A total of 13 human cases who died from HS were classified into the HS group, while another 16 human cases who died from hypothermia, mechanical injury, sudden cardiac disease, mechanical asphyxia, and severe hepatitis were selected as the control group (Table S3). Additionally, pertinent data including gender, age, medical records and autopsy reports were collected.
The expression of HSPA4, GGCX, and CYP2B6 in human cases of HS was verified using IHC. As shown in Fig. 6, a significant decrease in the expression of HSPA4 and significant increases in the expression of GGCX, and CYP2B6 were observed in the HS group when compared with the control group. These findings were consistent with the results obtained in the rat models, supporting the diagnosis value of HSPA4, GGCX, and CYP2B6 as biomarkers for HS at postmortem. The human original IHC images were shown in in Supplementary material 2.
Fig. 6.

Three candidate protein biomarkers (HSPA4, GGCX, and CYP2B6) were significantly different between HS human cases and control cases. (a) Representative pictures of IHC staining from three candidate biomarkers (HSPA4, GGCX, and CYP2B6) in death from HS group and control group. (200 ×, Bar: 100 μm; 400 ×, Bar: 50 μm). (b) Statistical analysis of mean density values for the IHC staining between HS group and control group (***: P ≤ 0.001; ****: P ≤ 0.0005).
Diagnostic efficacy of the liver protein biomarkers for HS
The Receiver Operating Characteristic (ROC) analysis was conducted based on the mean density values of IHC of three candidate biomarkers. The results revealed that the Area under the Curve (AUC) values for HSPA4, GGCX, and CYP2B6 were 0.745 (95% Confidence Interval (CI): 0.550–0.888, P = 0.0084), 0.856 (95% CI: 0.676–0.958, P < 0.0001), and 0.916 (95% CI: 0.752–0.986, P < 0.0001), respectively (Fig. 7).
Fig. 7.

ROC curve analysis results of the diagnostic efficiency for HSPA4, GGCX, CYP2B6, and combination of the two proteins. AUC: Area Under the Curve.
Furthermore, the diagnostic performance of combined indicators were evaluated, as well. Among the two biomarkers combinations, the pairs of HSPA4 & GGCX, HSPA4 & CYP2B6, as well as GGCX & CYP2B6, exhibited AUC values of 0.947, 0.986, and 0.933, respectively. When combining three biomarkers, the combination of HSPA4, GGCX, and CYP2B6 achieved the highest AUC (over 0.999). Therefore, the combination of these three biomarkers yield the best diagnostic prediction performance. Detailed results regarding the ROC analysis for the aforementioned biomarkers was summarized in Table 1.
Table 1.
The detailed information of diagnostic efficiency of the three protein biomarkers.
| Number | Index | AUC | 95% CI | Sensitivity (%) | Specificity (%) | P value | Std.error | Yoden index |
|---|---|---|---|---|---|---|---|---|
| 1 | HSPA4 | 0.745 | 0.550–0.888 | 100 | 43.75 | 0.0084 | 0.093 | 0.4375 |
| 2 | GGCX | 0.856 | 0.676–0.958 | 69.23 | 87.50 | < 0.001 | 0.069 | 0.5672 |
| 3 | CYP2B6 | 0.916 | 0.752–0.986 | 84.62 | 93.75 | < 0.001 | 0.0523 | 0.7837 |
| 4 | HSPA4 + GGCX | 0.947 | 0.795–0.996 | 92.31 | 87.50 | < 0.001 | 0.0384 | 0.7981 |
| 5 | HSPA4 + CYP2B6 | 0.986 | 0.855–1.000 | 100 | 93.75 | < 0.001 | 0.0173 | 0.9375 |
| 6 | GGCX + CYP2B6 | 0.933 | 0.775–0.992 | 92.31 | 81.25 | < 0.001 | 0.0443 | 0.7356 |
| 7 | HSPA4 + GGCX + CYP2B6 | Over 0.9999 | 0.881–1.000 | 99.999 | 99.999 | < 0.001 | < 0.0001 | 0.9999 |
Abbreviation: AUC: Area Under the Curve, CI: Confidence Interval, Std.Error: Standard Error
Discussion
In forensic practice, it is difficult to determine suspected HS cases especially when there are no clear circumstances or premortem clinical manifestations, including body temperature. Therefore, specific biomarkers are urgently needed for accurate postmortem diagnosis of HS. Liver failure is a common terminal step and a direct cause of death in HS patients. This study investigated the liver’s morphological and functional changes and protein biomarkers for postmortem diagnosis of HS.
The morphological and functional examination of liver tissues in HS rats revealed some obvious alterations, including focal hepatocyte hydropic degeneration and necrosis, and focal hemorrhage in this study. Kew et al.18 reported that extensive degenerative changes in hepatocytes, including cell death, are the most common pathological findings in HS-related liver damage. Our study similarly found elevated levels of serum ALT, AST, and AST/ALT ratio in HS rats, whereas TBIL levels remained normal. This implies that HS causes liver cell damage rather than bile duct injury. However, these changes are non-specific and insufficient for the diagnosis of HS in forensic practice.
Subsequently, TMT-based proteomics technology was employed to screened potential bimarkers. Three proteins (HSPA4, GGCX, and CYP2B6) were then validated as candidate protein biomarkers through Western blotting and IHC in HS rats. In addition, these candidate protein biomarkers were validated to show significant differences between human HS death cases and control groups. At last, diagnostic value of these three proteins in the autopsy cases of HS death were investigated. Each of these three protein biomarkers exhibited relatively high diagnostic abilities with appropriate sensitivity and specificity, thereby indicating their potential utility as biomarker for the postmortem diagnosis of HS. Particularly, the combination of HSPA4, GGCX and CYP2B6 emerged as the most effective set for diagnosing HS.
HSPA4 is a member of the heat shock protein (HSP) 70 family, playing a crucial role in cellular stress response, protein folding, and degradation19,20. In the early stages of HS, HSP levels increase rapidly, but these levels significantly decrease over time, resulting in abnormally low concentrations in the later stages of HS19. Jiang et al. has reported that serum HSP72 levels were lower in HS patients than in healthy volunteers21, and HSP72 overexpression attenuated heat-induced lethality, oxidative stress, and the expression of proinflammatory factors22. Similar to the previous studies, HSPA4 was markedly decreased in this study which may be related with high levels of inflammation and oxidative stress.
Dysregulated coagulation/fibrinolytic responses and thrombosis are critical pathogenic mechanisms in HS23,24. Specifically, Bouchama et al.25reported evidence of activated coagulation in baboon models of HS, as indicated by a prolonged prothrombin time (PT), an activated partial thromboplastin time (aPTT), and a decreased platelet count. With respect to the physiological anticoagulants, levels of antithrombin, protein C, and protein S were significantly decreased in HS, as well26. Additionally, results of a mouse model revealed that coagulation biomarkers could serve as biomarkers for HS, and more severe coagulation disorders were associated with poorer outcomes27. GGCX (gamma-Glutamyl carboxylase) is a vitamin K-dependent enzyme that is highly expressed in the liver and mainly located in endoplasmic reticulum28. GGCX catalyzes the gamma-carboxylation of multiple coagulation factors (factors II, VII, IX, and X) and natural anticoagulants (protein C, protein S, and protein Z), thereby playing a crucial role in blood coagulation, vascular wall maintenance, and the preservation of the balance between coagulation and anticoagulation29–31. Mutations in the GGCX gene can lead to a disorder characterized by a deficiency of all vitamin K—dependent coagulation factors, known as vitamin K-dependent coagulation factor deficiency type 1 (VKCFD1), which characterized by a mild to severe bleeding tendency and a moderate predisposition to thrombotic events32,33. The increased expression of GGCX in HS group may enhance blood coagulation to a greater extent, thereby contributing to the thrombosis.
CYP2B6 protein is a member of the cytochrome P450 (CYP 450 s) superfamily of enzymes. The CYP 450, functioning as monooxygenases, play a pivotal role in catalyzing multiple reactions associated with drug metabolism as well as the synthesis of cholesterol, steroids, and other lipids in liver34. It has been reported that CYP450 is associated with liver injury induced by a variety of exogenous drugs and the metabolism of endogenous toxins35. Additionally, dysregulations of CYP450 under liver injury have been extensively reported and studied36. The pathophysiological processes of HS encompass inflammatory response, abnormal energy metabolism, and disorders of endogenous metabolites, including hormonal imbalances and dysregulation of lipid metabolism37. The CYP450 proteins may be involved in the pathophysiological process of HS by influencing the metabolic and detoxification functions of the liver. In this study, the increase expression of CYP2B6 might be associated with the elevation of a large number of toxic substances in the body during HS.
Overall, HSPA4, GGCX and CYP2B6 were validated as protein biomarkers for the postmortem diagnosis of HS. The biomarkers of HS in medicine were usually studied to help the clinician to detect organ injury and predict outcomes. Most biomarkers were related to HS-induced cellular injury and tissue damage. Moreover, the biomarkers are mainly explored in the blood from HS patients in clinical practice. Proteins such as the histone H3, thrombomodulin, and high mobility group box protein 1 have been extensively studied as serum biomarkers in HS patient, which mainly focus on the inflammatory response and coagulation dysfunction38–41. However, these biomarkers may not be applicable by IHC method in postmortem bodies. No specific biomarkers at premortem and postmortem have been identified so far for liver injury in HS. Therefore, further exploration is needed for the relationship between the selected biomarker in this study with other known HS related biomarkers.
Differential diagnoses for HS such as drug-induced hyperthermia, and other conditions shared similar symptoms with HS can be distinguished through careful review of clinical history, laboratory tests, and environmental investigations clinically42. The differential diagnosis of HS with other causes of death was needed to be emphasized. Taken this into consideration, the control group consisted of cases of asphyxia, hypothermia,sudden cardiac disease and hepatitis-related deaths in this study. The selected three protein indicators across various causes of death enhanced the specificity and reliability of our findings in the context of HS fatalities. However, in forensic applications, whether these proteins can effectively distinguish HS with all situation, still requires further exploration.
Although our findings are significant, the limitations should be acknowledged. The number of validation on forensic human cases were relatively small. More human autopsy cases including HS and the other causes of death were needed to further validate the diagnostic efficacy and specificity of these biomarkers. In addition, the expression changes of these selected biomarkers at different stages of HS need to be deeply studied.
In conclusion, the TMT proteomic results, the validation of both rat models and human samples confirmed that the liver could serve as an alternative organ for diagnosing HS-related death. Three protein biomarkers (HSPA4, GGCX, and CYP2B6) in liver were identified as potentially effective biomarkers for the postmortem diagnosis of HS, thus providing a novel diagnostic approach in forensic practice. Moreover, the combined utilization of HSPA4, GGCX, and CYP2B6 protein biomarkers achieves the optimal diagnostic efficacy for HS. For suspected HS deaths occurring during heatwave, HS as the potential cause of death can be evaluated based on a combination of autopsy findings (such as focal hepatocellular degeneration, necrosis, and hemorrhage), abnormal liver function tests, and IHC of the three protein biomarkers in the liver, provided that other causes of death are excluded (Fig. 8).
Fig. 8.

Suggested diagnostic flow chart for post-mortem diagnosis of HS in forensic practice.
Materials and methods
Animal models
The adult male Sprague–Dawley rats (260 g-320 g, 8–12 weeks of age, SPF levels) were purchased from the Animal Center of Tongji Medical College, Huazhong University of Science and Technology (Hubei, China), and were housed in an environment condition of ambient temperature (T: 25 ± 1℃, relative humidity: 35% ± 5) for 1 week prior to the experiment. The rats obtained food and water ad libitum and were kept on a 12-h day-night cycle. All animal experiments were conducted in accordance with the ARRIVE Guidelines, the Guide for the Care and Use of Laboratory Animals (https://grants.nih.gov/grants/olaw/guide-for-the-care-and-use-of-laboratory-animals.pdf), and approved by the Animal Care and Use Committee of the animal core facility at Huazhong University of Science and Technology and performed in accordance with those relevant guidelines and regulations.
All rats were fasted for 12 h before the experiment but allowed water without limitations. The rats were randomly divided into two groups: the HS group (n = 6) and the control group (n = 6). The rats in the HS group were then placed in an artificial climate chamber to induce HS without food or water until death22. The artificial climate chamber temperature was stabilized at 41.0 ± 0.5 °C in advance, with a relative humidity of 60 ± 5%. To measure Tc, the animal electronic thermometer (CZ3457; Shandong, China) was used and inserted 3.0 cm into the rectum19,43. The Tc was measured at an interval of 30 min. The time at which blood pressure started decreasing from its peak level was designated as a reference point for the onset of HS. All control group rats were at a temperature of 25 ± 0.5 °C and a humidity of 35 ± 5%, and they were sacrificed by cervical dislocation after anesthesia with isoflurane gas. The blood was collected by the retro-orbital method and centrifuged at 12,000 r/min at 4℃ to obtain serum for liver function tests. Liver tissue from each rat was promptly extracted after death and divided into two parts: one part was stored in a −80 °C refrigerator for proteomics and western blot, while the remaining liver tissue was excised, immersed in 10% neutral buffered formalin overnight, and subsequently embedded in paraffin blocks for histology and IHC tests.
Human cases
Human cases were collected from the Department of Forensic Medicine of Huazhong University of Science and Technology and the Department of Forensic pathology of Wannan medical college. A total of 13 human cases who died from HS were classified into the HS group, while another 16 human cases who died from hypothermia, mechanical injury, sudden cardiac disease, mechanical asphyxia, and severe hepatitis were selected as the control group. IHC staining was subsequently performed in all human cases to validate the candidate proteins biomarkers. Additionally, pertinent data including gender, age, medical records and autopsy reports were collected. Written Informed consent for the analysis of human samples was obtained from the family of the deceased. The use of all human cases were approved by the Ethics Committee of Huazhong University of Science and Technology. All methods involving human subjects were performed in accordance with the Declaration of Helsinki and the relevant regulations of the Ethics Committee of Huazhong University of Science and Technology.
Liver function tests of HS rat
Serum ALT, serum AST, serum TBIL, and AST/ALT ratio were measured using a fully automated biochemical analyzer (Chemray 800, China).
Tandem Mass Tag (TMT)-based proteomics and bioinformatics analysis
Protein extraction, Peptide Digestion, and TMT labeling
Protein samples were prepared from liver tissues using a lysis buffer (P0013B; Beyotime, Shanghai, China) and quantified using the Bradford method. 100 μg protein samples were diluted with 0.5 M Triethylammonium Bicarbonate (TEAB). Then proteins were digested into peptides using trypsin. The digested pepetide solution was desalted and subsequently freeze-dried. Each tube of TMT (0.8 mg) reagent was dissolved in 41μL of acetonitrile (ACN) and shaken suffitiently to fully dissolve. The digested and desalted peptide fragment was resuspended in 0.1 M TEAB buffer to achieve a peptide concentration of 3.74 μg/μL. Took 100 μg of peptide (26.7μL) and 41μL of TMT reagent for rapid mixing, and then checked the pH value between 7.0–8.0. The labeled peptides were then incubated at room temperature for 2 h to ensure sufficient labeling.
Peptide Fractionation
The Shimadzu LC-20 AB liquid phase system and a 5 um 4.6 × 250 mm Gemini C18 separation column was used for liquid phase separation of the sample. The mobile phase A was mainly composed of 5% ACN at PH 9.8, and the mobile phase B was mainly composed of 95% ACN at PH 9.8. The dried labeled peptide samples were reconstituted with mobile phase A and injected at a flow rate of 1 mL/min by following gradients: 5% mobile phase B for 10 min, 5% to 35% mobile phase B for 40 min, 35% to 95% mobile phase B for 1 min, mobile phase B for 3 min, and 5% mobile phase B for 10 min. The elution peak was monitored a wavelength of 214 nm, and fractions were collected per minute. A total of 20 fractions were obtained based on the combination of the chromatographic elution peaks, which were then freeze-dried.
High Performance Liquid Chromatography (HPLC) and Mass Spectrometry detection
The mobile phase A was mainly composed of 2% ACN and 0.1% Formic Acid (FA), and the mobile phase B was mainly composed of 80% ACN and 0.1% FA. The dried peptide samples were dissolved in mobile phase A, centrifuged at 20,000 g for 10 min, and the supernatant was taken for injection. The Easy-nLC 1200 (Thermo Fisher Scientific, San Jose, CA) was performed for separation. The sample entered a self-packed C18 column (75 μm internal diameter, 1.9 μm column size, 25 cm column length) and separated at a flow rate of 200 nL/min by the following gradient: 5% mobile phase B for 3 min, mobile phase B linearly increased from 8 to 44% for 42 min, mobile phase B rose from 44 to 60% for 5 min, mobile phase B rose from 60 to 100% for 3 min, 80% mobile phase B for 7 min. The peptides separated by liquid phase chromatography were ionized by a nanoESI source and then passed to a tandem mass spectrometer Oritrap Exploris 480 (Thermo Fisher Scientific, San Jose, CA) for Data Dependent Acquisition (DDA) mode detection. The main parameter settings were as follows: the ion source voltage was set to 2.1 kV, the MS1 mass spectrometer scanning range was 350 ~ 1,600 m/z with a resolution of 60,000; the MS2 starting m/z was fixed at 100 with a resolution of 15,000. The ion screening conditions for MS2 fragmentation were: charge states from 2 + to 7 +, and the two most intense precursor ions with a peak intensity exceeding 50,000 were selected. The ion fragmentation mode was higher-energy collisional dissociation (HCD), and the fragment ions were detected in the Orbitrap. The dynamic exclusion time was set to 30 s. The automatic gain control (AGC) setting were: MS1, 1E6; MS2 1E5.
Raw data processing and bioinformatics analysis
The Proteome Discover 1.4 software (Thermo Scientific) was used to convert the raw MS data into MGF format. The MGF format content includes the Query title, the Peptide mass, the Peptide charge, Retention time, and Scan number. The exported MGF files were searched by the “local Mascot server” based on the following databases: NCBInr, SwissProt, and Uniprot. Subsequently, calculating the TMT labeling efficiency from data exported through the Mascot server ensured the validity of the acquired data. An automated software called “IQuant”44 (Version1, http://sourceforge.net/projects/iquant/) was used to quantitatively analyze the peptides labeled with isobaric tags. The quantification parameters involved all unique peptide, at least one unique spectrum, normalization, the weighted average, and permutation tests. Afterwards, the data statistical analysis was conducted using three programming languages: R, Perl, and Python. To assess the peptide confidence, the Peptide Spectrum Match (PSMs) were prefiltered at a PSM-level false discovery rate (FDR) of 1%. Then based on the “simple principle” (The parsimony principle), identified peptide sequences were assembled into a set of confident proteins45.
To control the rate of false-positive at the protein level, a protein FDR at 1%, based on the Picked protein FDR strategy, was also estimated after protein inference (Protein-level FDR ≤ 0.01). The protein quantification process includes the following steps: Protein identification, Tag impurity correction, Data normalization, Missing value imputation, Protein ratio calculation, Statistical analysis, and Results presentation. All proteins with an FDR < 1% were subjected to downstream analysis, including Gene Ontology (GO), Clusters of Orthologous Groups of proteins in Eukaryotes (KOG) and Pathway analysis. Furthermore, deep analysis based on DEPs were also performed, such as GO enrichment analysis, and KEGG pathway enrichment analysis46 (http://www.genome.jp/kegg/pathway.html). Enrichment terms were defined as significant at q < 0.05. In addition, In this experiment, the subcellular localization of DEPs was predicted using the “WoLF Protein Subcellular Localization Predictor (WOLF PSORT)” software (Version1, https://wolfpsort.hgc.jp/)47. The number of DEPs was visualized using volcano plots at q < 0.05 and |Log 2 FC |> 1 screening criteria.
Western blotting
Proteins were extracted and quantified from frozen liver tissue for western blotting. Sodium dodecyl sulfate gels were prepared using a gel kit (20324ES62, 20326ES62, Yeasen). The protein samples were separated using 80 V constant voltage electrophoresis and run at 120 V constant pressure electrophoresis. Depending on the molecular weight of the target proteins, the gel bands were transferred onto polyvinylidene fluoride (PVDF) membranes under a constant current of 200 mA. The PVDF membranes were incubated in 5% skim milk for 2 h and then incubated in diluted primary antibody RASA4 (1:1500, PAB43047), SERPINA3 C (1:1000, 12,192–1-AP), HSPA4 (1:1000, 21,206–1-AP), GGCX (1:1000, PAB33008), CYP2B6 (1:1000, PAB32079), ACTB (1:2000, BM-3873, Boster), and GAPDH (1:120,00, 10,494–1-AP, Proteintech) at 4 °C overnight. PVDF membranes were then incubated with fluorescent-labeled goat anti-rabbit immunoglobulin G (IgG) (1:12,000, RS23920, Immunoway) at room temperature for 1 h. The strips were imaged using a chemiluminescence machine. The Image J software (Version-win64, https://imagej.net/ij/) was used to calculate the gray values of the protein images.
Immunohistochemistry staining and quantification analysis
The paraffin blocks of the liver tissue of HS rats were sectioned into 5 um thin slices. Liver tissues from human cases were directly sectioned from previously prepared paraffin blocks. Glass slides were routinely dehydrated, blocked with 3% hydrogen peroxide, immersed in citrate buffer, and heated in a microwave oven at an interval of 10 min for antigen retrieval. This antigen retrieval was repeated 2 times. The slides were sealed and blocked in 5% bovine serum albumin for 30 min at room temperature and then incubated in primary antibody against RASA4 (1:200, PAB43047), SERPINA3 C (1:200, 12,192–1-AP), HSPA4 (1:100, 21,206–1-AP), GGCX (1:200, PAB33008), and CYP2B6 (1:200, PAB32079) at 4 °C overnight. Subsequently, biotinylated goat anti-rabbit IgG was added dropwise and incubated for 30 min at room temperature. Diaminobenzidine staining was then performed. After gradient dehydration and xylene transparency, the slides were sealed with a neutral resin.
A stringent criteria was then applied to quantitatively analyze the IHC staining signals. At 200 × magnification, three randomly selected microscope fields from each slide were analyzed using Image J software (Version-win64, https://imagej.net/ij/). Tissues with overlapping structure and contaminated backgrounds were excluded from analysis. The staining intensity within each field of view was quantified as the Total Integrated Optical Density (IOD) value, which was calculated by summing the intensity values of each pixel within the observed area. This value reflects both the color intensity and the degree of positivity. To account for the influence of tissue area on the total IOD, the Average Optical Density (MOD) value was ultilized as the final metric. The MOD value was calculated by dividing the total IOD by the total tissue area.
For each individual case, the staining intensity of each protein biomarkers (mean density of the case) was expressed as the mean value of three microscopic fields. The quantitative assessment of IHC staining was conducted in a blinded manner.
Statistical analysis
Statistical analysis were performed using SPSS version 25.0, Graphpad prism 8.0, and MedCalcStatistical Software (Version 19.2, https://www.medcalc.org/). The parametric Student’s t-test or nonparametric Mann–Whitney test was used to compare numerical variables between two groups. ROC analysis was performed to assess the diagnostic sensitivity and specificity of candidate protein biomarkers. The p-value for the ROC curve was conducted by Medcalc 20.0. Test results with two tailed p < 0.05 was considered statistically significant.
Supplementary Information
Author contributions
Conceptualization and Methodology: Meichen Pan, Huine Liu, and Hongmei Dong; Investigation: Tianying Sun, Chuxiong Ma, and Li Yang; Writing-original draft preparation: Meichen Pan, Hongmei Dong; Writing-review and editing: Meichen Pan, and Hongmei Dong; Supervision: Hongmei Dong.
Funding
This work was supported by The National Natural Science Foundation of China (grant number: 82072117).
Data availability
The datasets generated and/or analyzed during the current study are available from the corresponding author on reasonable request.
Declarations
Competing interests
The authors declare no competing interests.
Animal ethics
All animal experiments were conducted in accordance with the ARRIVE Guidelines, the Guide for the Care and Use of Laboratory Animals (https://grants.nih.gov/grants/olaw/guide-for-the-care-and-use-of-laboratory-animals.pdf), and approved by the Animal Care and Use Committee of the animal core facility at Huazhong University of Science and Technology and carried out in accordance with relevant regulations.
Human ethics
The use of all human cases were approved by the Ethics Committee of Huazhong University of Science and Technology. All methods involving human subjects were performed in accordance with the Declaration of Helsinki.
Informed consent
Written Informed consent for the analysis of human samples was obtained from the family of the deceased.
Footnotes
Publisher’s note
Springer Nature remains neutral with regard to jurisdictional claims in published maps and institutional affiliations.
Supplementary Information
The online version contains supplementary material available at 10.1038/s41598-025-00963-x.
References
- 1.Epstein, Y. & Yanovich, R. Heatstroke. N Engl J Med.380(25), 2449–2459 (2019). [DOI] [PubMed] [Google Scholar]
- 2.Liu SY, Song JC, Mao HD, Zhao JB, Song Q; Expert Group of Heat Stroke Prevention and Treatment of the People’s Liberation Army, and People’s Liberation Army Professional Committee of Critical Care Medicine. Expert consensus on the diagnosis and treatment of heat stroke in China. Mil Med Res. 2020;7(1):1. Published 2020 Jan 13.
- 3.Argaud, L. et al. Short- and long-term outcomes of heatstroke following the 2003 heat wave in Lyon France. Arch. Intern. Med.167(20), 2177–2183 (2007). [DOI] [PubMed] [Google Scholar]
- 4.Palmiere, C. & Mangin, P. Hyperthermia and postmortem biochemical investigations. Int. J. Legal. Med.127(1), 93–102 (2013). [DOI] [PubMed] [Google Scholar]
- 5.Marrone, M. et al. Heat Stroke in the work environment: Case report of an underestimated phenomenon. Int. J. Environ. Res. Public Health.20(5), 4028 (2023). [DOI] [PMC free article] [PubMed] [Google Scholar]
- 6.Zhu, B. L. et al. Differences in postmortem urea nitrogen, creatinine and uric acid levels between blood and pericardial fluid in acute death. Leg. Med. (Tokyo).9, 115–122 (2007). [DOI] [PubMed] [Google Scholar]
- 7.Zhu, B. L. et al. Postmortem cardiac troponin T levels in the blood and pericardial fluid Part 1 Analysis with special regard to traumatic causes of death. Leg Med (Tokyo)8, 86–93 (2006). [DOI] [PubMed] [Google Scholar]
- 8.Quan, L. et al. Quantitative analysis of ubiquitin-immunoreactivity in the midbrain periaqueductal gray matter with regard to the cause of death in forensic autopsy. Leg Med (Tokyo).7, 151–156 (2005). [DOI] [PubMed] [Google Scholar]
- 9.Ishikawa, T. et al. Immunohistochemical investigation of ubiquitin and myoglobin in the kidney in medicolegal autopsy cases. Forensic Sci. Int.171, 136–141 (2007). [DOI] [PubMed] [Google Scholar]
- 10.Lin, H. et al. Biochemical detection of fatal hypothermia and hyperthermia in affected rat hypothalamus tissues by Fourier transform infrared spectroscopy. Biosci. Rep. 10.1042/BSR20181633 (2019). [DOI] [PMC free article] [PubMed]
- 11.Wang, F. et al. The pathogenesis and therapeutic strategies of heat stroke-induced liver injury. Crit. Care26(1), 391 (2022). [DOI] [PMC free article] [PubMed] [Google Scholar]
- 12.Garcin, J. M., Bronstein, J. A., Cremades, S., Courbin, P. & Cointet, F. Acute liver failure is frequent during heat stroke. World J. Gastroenterol.14(1), 158–159 (2008). [DOI] [PMC free article] [PubMed] [Google Scholar]
- 13.Sato, A. et al. Massive intestinal liquid retention in a case of severe heat stroke. J. Paediatr. Child Health.55(2), 248–249 (2019). [DOI] [PubMed] [Google Scholar]
- 14.Frise, C. J. & Williamson, C. Gastrointestinal and liver disease in pregnancy. Clin. Med. (Lond).13(3), 269–274 (2013). [DOI] [PMC free article] [PubMed] [Google Scholar]
- 15.Jin, F. Q. et al. Acute hepatic failure as a leading manifestation in exertional heat stroke. Case Rep Crit Care.2012, 295867 (2012). [DOI] [PMC free article] [PubMed] [Google Scholar]
- 16.Ebi, K. L. et al. Hot weather and heat extremes: health risks. Lancet398(10301), 698–708 (2021). [DOI] [PubMed] [Google Scholar]
- 17.Solier, C. & Langen, H. Antibody-based proteomics and biomarker research - current status and limitations. Proteomics14(6), 774–783 (2014). [DOI] [PubMed] [Google Scholar]
- 18.Kew, M. C., Minick, O. T., Bahu, R. M., Stein, R. J. & Kent, G. Ultrastructural changes in the liver in heatstroke. Am. J. Pathol.90(3), 609–618 (1978). [PMC free article] [PubMed] [Google Scholar]
- 19.Lin, X. et al. Myricetin against myocardial injury in rat heat stroke model. Biomed. Pharmacotherapy.127, 110194 (2020). [DOI] [PubMed] [Google Scholar]
- 20.Feder, M. E. & Hofmann, G. E. Heat-shock proteins, molecular chaperones, and the stress response: evolutionary and ecological physiology. Annu. Rev. Physiol.61, 243–282 (1999). [DOI] [PubMed] [Google Scholar]
- 21.Wang, Z. Z. et al. Autoantibody response to heat shock protein 70 in patients with heatstroke. Am. J. Med.111(8), 654–657 (2001). [DOI] [PubMed] [Google Scholar]
- 22.Chen, Z.-C. et al. Protective effect of transgenic expression of porcine heat shock protein 70 on hypothalamic ischemic and oxidative damage in a mouse model of heatstroke. BMC Neurosci.10.1186/1471-2202-10-111 (2009). [DOI] [PMC free article] [PubMed] [Google Scholar]
- 23.Iba, T., Helms, J., Levi, M. & Levy, J. H. Inflammation, coagulation, and cellular injury in heat-induced shock. Inflamm. Res.72(3), 463–473 (2023). [DOI] [PubMed] [Google Scholar]
- 24.Iba, T., Connors, J. M., Levi, M. & Levy, J. H. Heatstroke-induced coagulopathy: Biomarkers, mechanistic insights, and patient management. EClinicalMedicine.44, 101276 (2022). [DOI] [PMC free article] [PubMed] [Google Scholar]
- 25.Bouchama, A. et al. Inflammatory hemostatic and clinical changes in a baboon experimental model for heatstroke. J. Appl. Physiol.98(2), 697–705 (2005). [DOI] [PubMed] [Google Scholar]
- 26.Umemura, Y. et al. Bone marrow-derived mononuclear cell therapy can attenuate systemic inflammation in rat heatstroke. Scand. J. Trauma. Resusc Emerg. Med.26(1), 97 (2018). [DOI] [PMC free article] [PubMed] [Google Scholar]
- 27.Proctor, E. A. et al. Coagulopathy signature precedes and predicts severity of end-organ heat stroke pathology in a mouse model. J. Thromb. Haemost.18(8), 1900–1910 (2020). [DOI] [PMC free article] [PubMed] [Google Scholar]
- 28.De Vilder, E. Y., Debacker, J. & Vanakker, O. M. GGCX-Associated Phenotypes: An overview in search of genotype-phenotype correlations. Int. J. Mol. Sci.18(2), 240 (2017). [DOI] [PMC free article] [PubMed] [Google Scholar]
- 29.Rishavy, M. A. et al. GGCX mutants that impair hemostasis reveal the importance of processivity and full carboxylation to VKD protein function. Blood140(15), 1710–1722 (2022). [DOI] [PMC free article] [PubMed] [Google Scholar]
- 30.Hao, Z. et al. γ-Glutamyl carboxylase mutations differentially affect the biological function of vitamin K-dependent proteins. Blood137(4), 533–543 (2021). [DOI] [PMC free article] [PubMed] [Google Scholar]
- 31.Roberts, G.-T. et al. Microvascular Injury, Thrombosis, Inflammation, and Apoptosis in the Pathogenesis of Heatstroke[J]. Arterioscler. Thromb. Vasc. Biol.28(6), 1130–1136 (2008). [DOI] [PubMed] [Google Scholar]
- 32.Brenner, B. et al. A missense mutation in gamma-glutamyl carboxylase gene causes combined deficiency of all vitamin K-dependent blood coagulation factors. Blood92(12), 4554–4559 (1998). [PubMed] [Google Scholar]
- 33.Weston, B. W. & Monahan, P. E. Familial deficiency of vitamin K-dependent clotting factors. Haemophilia14(6), 1209–1213 (2008). [DOI] [PMC free article] [PubMed] [Google Scholar]
- 34.Manikandan, P. & Nagini, S. Cytochrome P450 Structure, Function and Clinical Significance: A Review. Curr Drug Targets.19(1), 38–54 (2018). [DOI] [PubMed] [Google Scholar]
- 35.Teschke, R. & Danan, G. Idiosyncratic Drug Induced Liver Injury Cytochrome P450 Metabolic Risk Factors and Lipophilicity: Highlights and Controversies. Int. J. Mol. Sci.22(7), 3441 (2021). [DOI] [PMC free article] [PubMed] [Google Scholar]
- 36.Xie, Y. et al. Cytochrome P450 dysregulations in thioacetamide-induced liver cirrhosis in rats and the counteracting effects of hepatoprotective agents. Drug Metab. Dispos.40(4), 796–802 (2012). [DOI] [PubMed] [Google Scholar]
- 37.Zhang, Z. et al. Heat stroke: Pathogenesis, diagnosis, and current treatment. Ageing. Res. Rev.100, 102409 (2024). [DOI] [PubMed] [Google Scholar]
- 38.Dehbi, M. et al. Toll-like receptor 4 and high-mobility group box 1 are critical mediators of tissue injury and survival in a mouse model for heatstroke. PLoS ONE7(9), e44100 (2012). [DOI] [PMC free article] [PubMed] [Google Scholar]
- 39.Bouchama, A., Hammami, M. M., Haq, A., Jackson, J. & alSedairy, S. Evidence for endothelial cell activation/injury in heatstroke. Crit Care Med.24(7), 1173–1178 (1996). [DOI] [PubMed] [Google Scholar]
- 40.Zhang, X. et al. The liver sinusoidal endothelial cell damage in rats caused by heatstroke. Europ. J. Inflamm.16, 2058739218794328 (2018). [Google Scholar]
- 41.Tong, H. S. et al. Early elevated HMGB1 level predicting the outcome in exertional heatstroke. J. Trauma.71(4), 808–814 (2011). [DOI] [PubMed] [Google Scholar]
- 42.Epstein, Y. & Yanovich, R. Heatstroke. N. Engl. J. Med.380(25), 2449–2459 (2019). [DOI] [PubMed] [Google Scholar]
- 43.Chao, C. M. et al. Proteomic analysis of hypothalamic injury in heatstroke rats. Proteomics15(11), 1921–1934 (2015). [DOI] [PubMed] [Google Scholar]
- 44.Wen, B. et al. IQuant: an automated pipeline for quantitative proteomics based upon isobaric tags. Proteomics14(20), 2280–2285 (2014). [DOI] [PubMed] [Google Scholar]
- 45.Savitski, M. M., Wilhelm, M., Hahne, H., Kuster, B. & Bantscheff, M. A Scalable Approach for Protein False Discovery Rate Estimation in Large Proteomic Data Sets. Mol. Cell. Proteomics.14(9), 2394–2404 (2015). [DOI] [PMC free article] [PubMed] [Google Scholar]
- 46.Kanehisa, M. & Goto, S. KEGG: kyoto encyclopedia of genes and genomes. Nucleic. Acids Res.28(1), 27–30 (2000). [DOI] [PMC free article] [PubMed] [Google Scholar]
- 47.Horton P, Park KJ, Obayashi T, et al. WoLF PSORT: protein localization predictor. Nucleic Acids Res. 35(Web Server issue):W585-W587. (2007). [DOI] [PMC free article] [PubMed]
Associated Data
This section collects any data citations, data availability statements, or supplementary materials included in this article.
Data Citations
- Lin, H. et al. Biochemical detection of fatal hypothermia and hyperthermia in affected rat hypothalamus tissues by Fourier transform infrared spectroscopy. Biosci. Rep. 10.1042/BSR20181633 (2019). [DOI] [PMC free article] [PubMed]
Supplementary Materials
Data Availability Statement
The datasets generated and/or analyzed during the current study are available from the corresponding author on reasonable request.