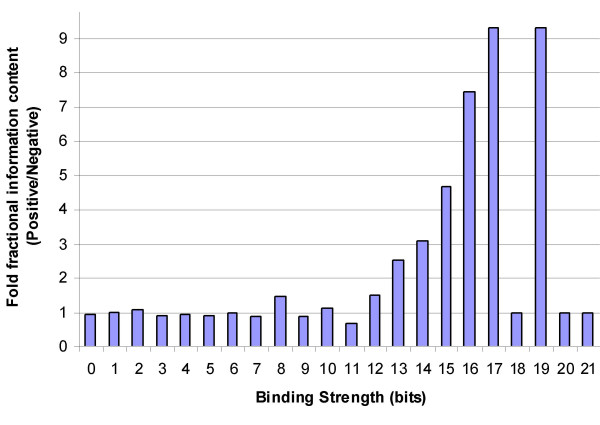
Figure 1.
Higher proportion of information content lies within stronger sites in promoter regions of regulated genes. A histogram representing strengths of putative binding sites for the transcription factor RXR/RXRα is shown. The x-axis represents the binding strength of a site in bits. The y-axis represents the relative ratio between the proportions of total information found at the corresponding strength in regulated and unregulated promoter regions (10 kb upstream of respective genes).

