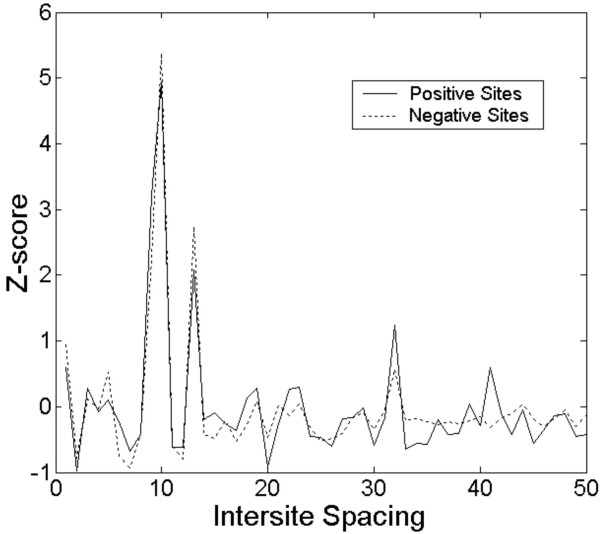
Figure 2.
Plot of inter-site distance and information content. The x-axis represents the spacing between a pair of sites expressed in number of bases, whereas the y-axis represents the corresponding pair-wise sum of information for all occurrences at a given spacing. The y-axis value is expressed in terms of a Z-score – units of standard deviation from the mean. The solid line represents the curve for a set of genes known to be regulated by PXR/RXRα, while the dotted line represents genes known to be unaffected by PXR/RXRα.

