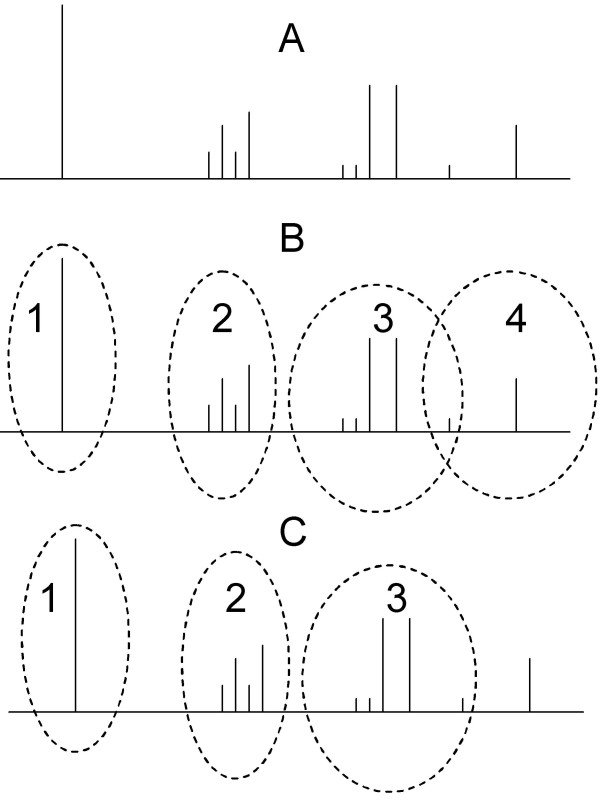
Figure 4.
Information Density Based Clustering (IDBC) Algorithm. The steps of IDBC are described in the Methods section. Panel A shows the location of putative binding sites upstream of the transcription start site. The vertical height of each bar indicates the strength of the respective binding site. Panel B shows the initial list of 4 clusters derived from the first iteration of the algorithm. This includes an example of an overlap where one of the sites is shared between clusters 3 and 4. Panel C shows the result of a refining step where the overlapping point is resolved, exclusively, to cluster 3. Since the single site in cluster 4 is not strong enough to be a cluster, the final clustering has only 3 clusters.

