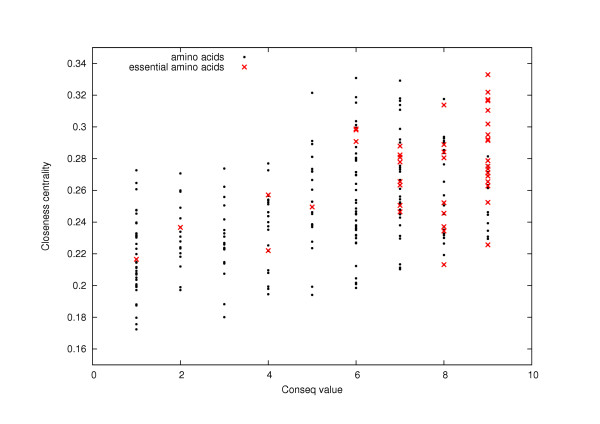
Figure 5.
Relationship between the closeness centrality and the Conseq value for TEM1 beta-lactamase. For each amino acid of TEM1 beta-lactamase, we plot the closeness centrality versus the Conseq value. We notice that the points are not approximately disposed along a "natural curve", which suggests that there is no strong natural "functional relationship" between these two centrality measurements and that we cannot deduce precisely one centrality measurement from the other one.

