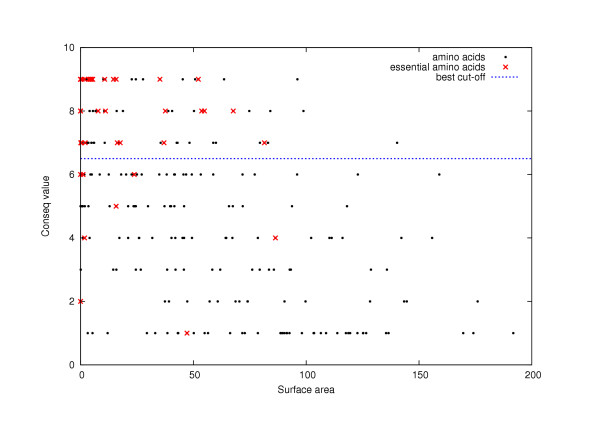
Figure 7.
Relationship between the Conseq value and the surface area for TEM1 beta-lactamase. For each amino acid of TEM1 beta-lactamase (1BTL), we plot the Conseq value versus the surface area. The best cut-off for the Conseq value is given by the "best cut-off curve: the set of residues above this curve is the set that minimizes the error dist(conseq value, cut-off).

