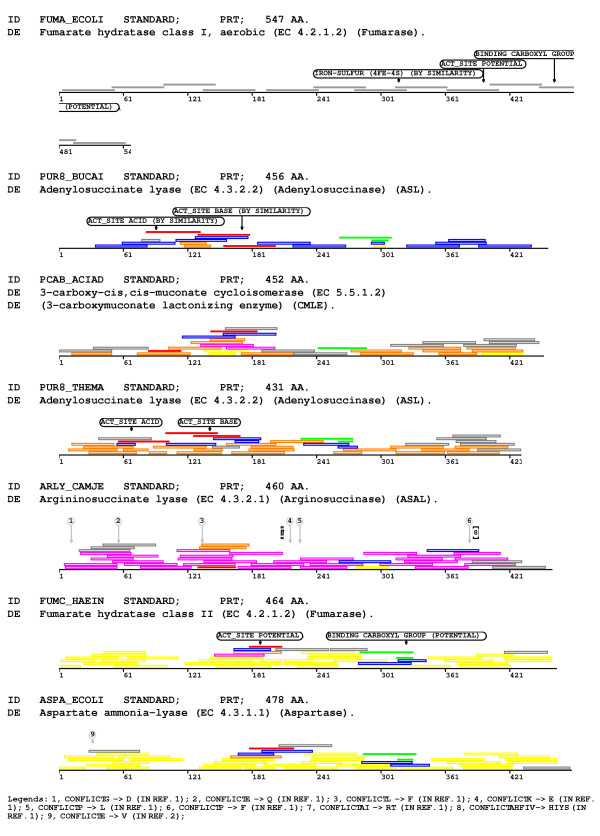
Figure 3.
Representative proteins of the prokaryotic lyases are shown together with matching probes at their respective positions. The probes mapping to the representative of the first independent group (FUMA_ECOLI) are represented as closed dark grey bars. Probes that map to the active sites of proteins of the second independent group are shown as closed red bars, and those that map the region identified by the Pfam HMM Lyase_1 (PF00206) as closed green bars. Probes that map specifically to the different subgroups are depicted as open bars using the following colours: blue, orange, magenta and yellow. Probes that are not specific for any particular subgroup are depicted as grey open bars. Features were obtained from the original Swiss-Prot annotation.

