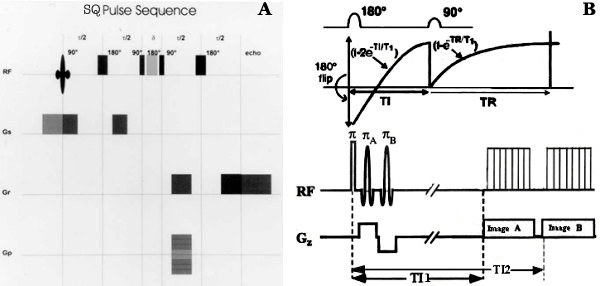
Figure 1.

The figure shows a spin echo pulse sequence with single quantum mode (A on left) and inversion recovery pulse sequence (B on right) using two inversion pulses for sodium imaging. The exponential return of the Mz after inversion is shown in graph in the center in relation to the RF pulses. The FID signal, produced by the 90° pulse after TE, has initial amplitude related to the value of Mz at the end of interval TI1 and TI2 due to applied selective π pulse. The insert highlights the unique optimum TI value in distinguishing tumor density associated with IC sodium in tumor.
