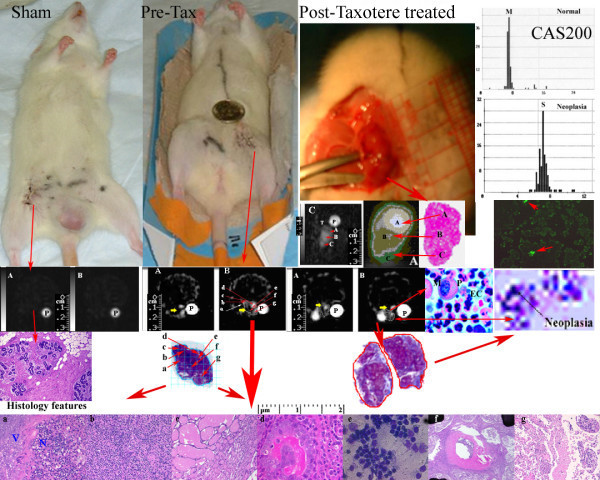
Figure 6.

The sham control, pre-treatment and Taxotere post-treated animals (top panels on left) show tumors as SQ sodium (A) and IR sodium (B) images at 0 hr pre-Taxotere and 24 hours post-Taxotere treatment (panels A and B on second row). On third row on left, control tumor histology shows normal vesicles. Pre- and post treated excised tumor histology by trichrome staining is shown with delineated area. On fourth row on left, the excised tumor histology features in high power fields are shown with arrows (active viable cells (a), proliferation (b), necrosis (c), apoptosis (d), mitosis (e), fibrous cyst (f), and infiltrating ductile carcinonoma (g) in different x- and y- coordinate locations after coregistration with IR sodium images. On right, panels on top show a IR sodium MR image before (C) and after non-parametric segmentation by Optimas 6.5 to highlight the different signal intensities that appeared hyperintense, isointense, and gray-green colored on segmented image and histology features showed them as apoptosis (A), necrosis (B) and neoplasia (C). On right, second row shows corresponding S DNA histograms of neoplasia features by CAS 200 (panels on top), apoptosis staining (panel with green stain). On right, third row shows a post-Taxotere treated tumor histology by pentachrome stain to highlight mitotic figures (M) with active PMN cells (P) and high EC volume (EC) and corresponding digitized map of DNA cycle, with neoplasia shown as arrow.
