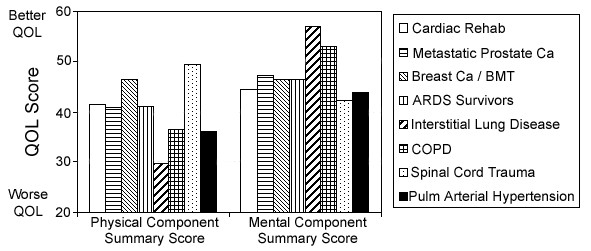
Figure 7.

Comparison of health-related quality of life scores between disease states. Shown are mean population scores for the physical and mental component summary scores of the SF-36. Scores shown are derived from previous reports of cardiac rehabilitation [20], metastatic prostate cancer unresponsive to therapy [21], bone marrow transplantation for breast cancer [22], survivors of acute respiratory distress syndrome [23], interstitial lung disease [24], chronic obstructive lung disease [25] and spinal cord injury [26]. Previously published scores were normalized for comparison, as described in methods. Data shown for patients with pulmonary arterial hypertension are from the present study (as in Figure 1), shown here for comparison. Y-axis indicates the physical and mental component summary scores of the SF-36.
