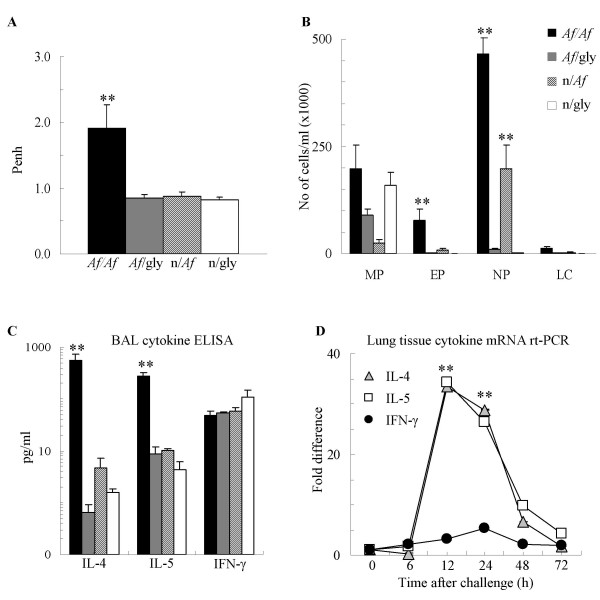
Figure 2.
Single intranasal provocation of sensitized mice with Af induced increase in Penh, inflammatory cell influx and Th2 but not Th1 cytokine release, 12 h After intranasal challenge. (A): Lung function measured by Penh. (B): BAL total and differential cell counts were used to calculate the absolute cell number. MP: macrophages EP: eosinophils, NP: neutrophils, LC: lymphocytes. (C): BAL Cytokine levels measured by ELISA (pg/ml). Mean ± SEM of n = 8 each; ** p < 0.01 (Af/Af vs. Af/gly) (D): Lung tissue cytokine mRNA levels measured by real-time PCR (fold increase in comparison to naïve control levels). ** p < 0.01 (vs. 0 h)

