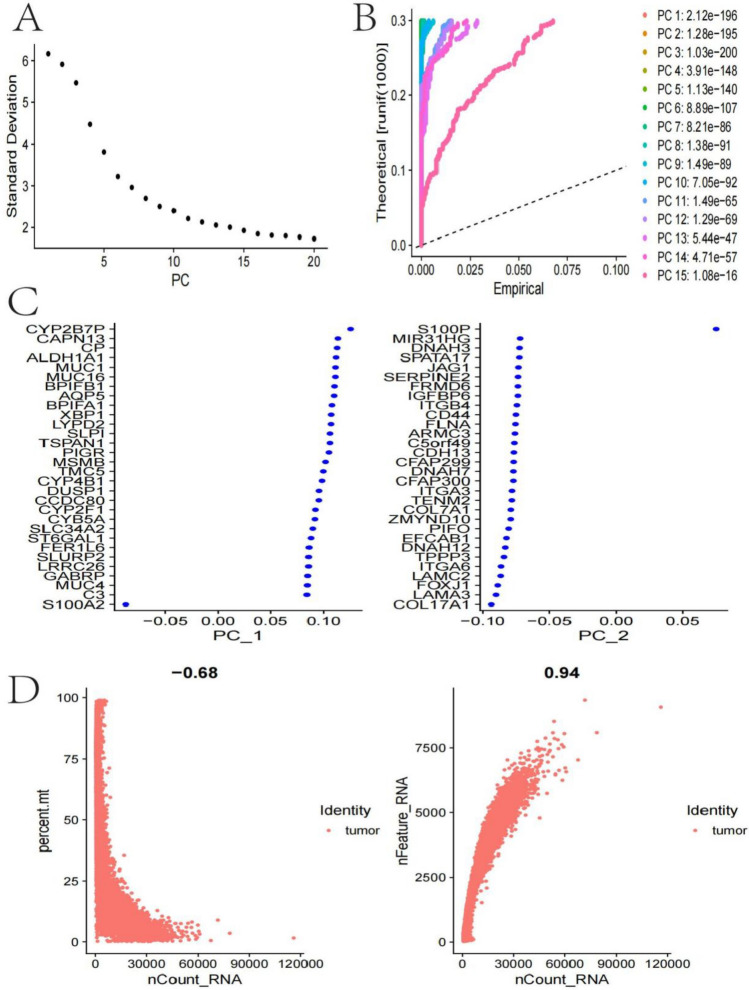
Fig. 5.
Single-Cell Transcriptome Profiling of Nasopharyngeal Carcinoma. A A PCA plot showed overall sample distribution, revealing significant transcriptional differences between tumor and non-tumor cells. B Distribution of principal component scores highlighted multiple layers of transcriptional heterogeneity within nasopharyngeal carcinoma samples. C A scatter plot showed gene loadings on the first two principal components, highlighting markers for various cell types. D: Plots of total RNA count and number of expressed genes per cell exhibited bimodal patterns, reflecting transcriptional differences between tumor and non-tumor populations

