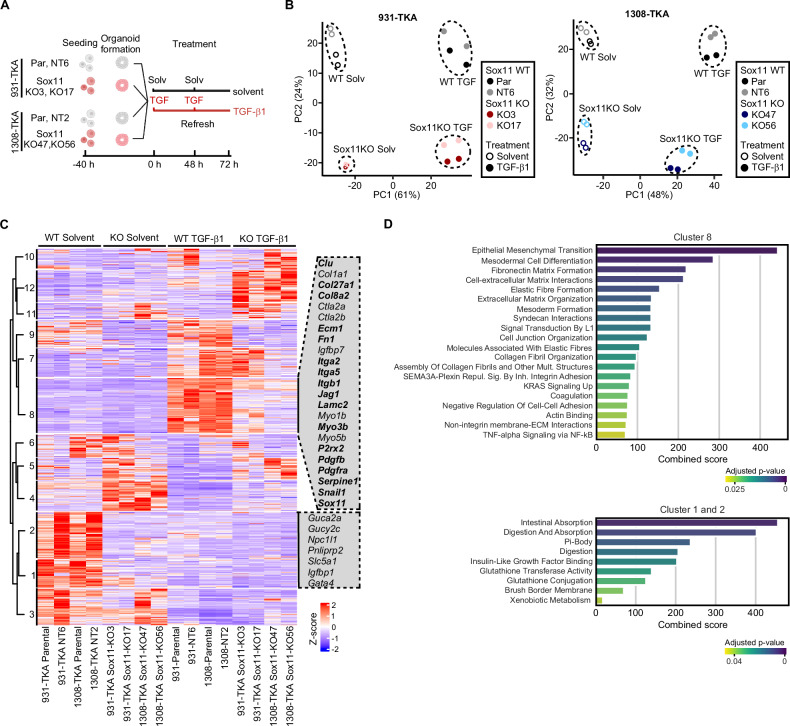
Fig. 5. Bulk RNA-seq reveals multiple functions of Sox11 in resting and TGF-β1-stimulated organoid cells.
A Experimental set-up. Sox11 WT and mutant organoid lines, as indicated, were seeded in 3 mg/ml Matrigel and treated with solvent or TGF-β1 for 72 h, followed by RNA collection and next generation sequencing. The figure was generated with BioRender.com. B Principal component analyses of RNA-seq results from the indicated Sox11 WT and mutant organoid lines cultured in conditions as shown. The color codes specify Sox11 genotypes. Empty and filled symbols distinguish samples treated with solvent or TGF-β1 for 72 h. C Heatmap showing differentially expressed genes in the indicated Sox11 WT and mutant organoid lines treated with solvent or TGF-β1 for 72 h. Genes with absolute values of log2 fold changes of expression > 1 and adjusted p values < 0.05 in any condition when comparing Sox11 WT and mutant organoid lines were extracted from the bulk RNA-seq results. Gene expression levels in counts per million (CPM) were then normalized by z-score transformation, sorted with a pre-determined number of 12 clusters, and visualized in the heatmap. Selected genes from clusters 1, 2, and 8 are shown next to the heatmap. Bold type identifies members of the Sox11 regulon with an importance score < 300. The color code indicates z-scores of the genes. D Pathway analyses. Differentially expressed genes from clusters 1, 2, and 8 in (C) were examined for enrichment of gene expression signatures from the MSigDB Hallmark and Reactomes datasets and the GO collections Biological Process, Cellular Component, and Molecular Function. Results of pathway analyses are given as combined scores based on adjusted p-values and odds ratios, which reflect the fraction of genes from a given gene set showing enrichment among DEGs versus the total number of genes in the respective set. Color codes indicate adjusted p values with Fisher’s exact test.

