



Abstract
Evaluating the performance of hospitals, the largest budget consumers of the health system, is challenging. This scoping review aimed to identify and classify hospital performance evaluation models and their dimensions. A literature search was conducted across three databases using keyword combinations. The studies included performance evaluation models along with evaluation of efficiency, effectiveness, and efficiency related to the hospital. Eighty English language studies published between 2012 and 2022, the majority from Iran, USA, Brazil, and China, were included. The extracted models were classified into two categories: quantitative and qualitative. The quantitative models were divided into two main groups: ‘parametric’ and ‘non-parametric’. Parametric models were divided into four methods: regression models, stochastic frontier analysis, neural network models, and factor analysis. Non-parametric models can be classified into five groups: data envelopment analysis (DEA) models, multi-criteria decision-making methods, performance management models, service quality models, and other models. The DEA model, which includes extensive functions, was the most common model used for evaluating hospital performance. Quantitative models for evaluating hospital performance focused on performance and efficiency terms. A key priority for future research is to compare the extracted models with real data from different hospitals and provide the most useful model according to the contextual factors of the hospital.
Keywords: Data envelopment analysis (DEA), hospital, performance evaluation
Introduction
Health systems worldwide are under increasing pressure to reduce costs and improve the quality of care.[1] Healthcare expenditures are being increased significantly in many countries every year. Thus, there is an urgent need to contain healthcare costs.[2]
Hospitals can be considered the biggest consumers of health system resources.[3] Evidence shows that a large share of total current health expenditures can be attributed to hospitals. It ranged from 28.3% in Germany to 53.2% in Turkey in 2017. For 21 OECD countries, 35% of total current health expenditures were reported to be attributed to hospitals in the same year.[1]
It is evident that the costs and quality of health services depend on the general performance of healthcare providers, such as hospitals. It is believed that the performance of many of those providers is lower than expected.[4] Thus, many researchers have explored these performance concepts and recommended ways to evaluate them to compare and improve hospitals’ performance levels.[5]
Thus, evaluating the performance of today’s public healthcare system worldwide has become a growing research challenge.[6] Every organization inevitably needs performance evaluation systems,[7] with a multi-dimensional approach.[8] Performance evaluation leads to a set of actions and activities that are carried out to increase the optimal use of resources to achieve goals efficiently and effectively.[9] Therefore, the results of evaluation studies could provide policy makers and health managers with useful information to identify key priority areas for improvement in healthcare organizations, for example, hospitals where they are in charge of improvement. Particularly in hospitals, a suitable and practical model for performance evaluation can increase responsiveness and improve service quality, which increases patient satisfaction.[10,11] Needless to say, performance evaluation and performance improvement are similar to two sides of the same coin, so adopting measures for the former will lead to changes in the latter.[10,12] In other words, proper hospital performance evaluation is necessary for decision-making, operational effectiveness, and strategy formulation. If a hospital’s performance is not measured, there will definitely be no improvement.[5]
Several models have been introduced to evaluate the performance of organizations.[9,12,13,14,15,16] However, there is still a lack of consensus on the best method for evaluating hospital performance.[17] In doing so, it seems necessary to increase our knowledge regarding hospital performance evaluation models used in different studies in addition to the most commonly used models. Thus, the aim of this study is to systematically review hospital performance evaluation studies to explore the scope of those studies in terms of the models used, performance dimensions measured, and so on. Overall, this paper aims to 1) examine hospital performance evaluation models; 2) identify and present the most suitable model for comparing, ranking, and scoring the performance of different hospitals; and 3) determine the most commonly used model. The results of this paper will provide hospital managers and researchers with a comprehensive collection of hospital performance evaluation models, helping them to select the most appropriate models for evaluating the performance of their own hospitals.
Materials and Methods
A scoping review was conducted by the following methods outlined by Arksey and O’Malley[18] and Tricco.[19] This scoping review aims to map the literature in terms of the volume, nature, and characteristics of the primary research conducted in that field.[20] Therefore, a systematic search for published and English-language literature about hospital performance evaluation models was conducted using three databases, PubMed, Scopus, and Web of Science, from 2012 to 2022. Initially, the identified keywords were refined and validated by a team composed of three university academic members and two hospital managers. Then, a combination of vocabularies was identified by the authors through a brainstorming process. The search strategy was formulated using Boolean operators. The search terms used were as follows: ((((hospital*[Title]) AND (performance[Title/Abstract] OR efficiency [Title/Abstract] OR effectiveness[Title/Abstract] OR productivity[Title/Abstract])) AND (evaluati* [Title/Abstract] OR assessment[Title/Abstract] OR benchmarking[Title/Abstract])) AND (model [Title/Abstract] OR framework[Title/Abstract])) NOT (“economic evaluation”[Title/Abstract] OR “cost utility”[Title/Abstract] OR “cost effectiveness”[Title/Abstract] OR “cost-utility”[Title/Abstract] OR “cost-effectiveness”[Title/Abstract]) Filters: in the last 10 years, English.
In the screening process, relevant references related to hospital performance evaluation were screened and abstracted into researcher-developed Excel forms by independent dual review, and conflicting adjudication was provided by other reviewers.
The inclusion criteria were as follows: (i) a focus on the hospital setting, (ii) available full text, and (iii) written in English. The exclusion criteria were as follows: (i) focused solely on the evaluation of specific criteria without considering the entire hospital, (ii) lacked appropriate data (only evaluated specific indicators), (iii) focused only on clinical performance aspects, performance evaluation validation models, and simulation examination or hospital reform evaluation.
For extracting the data, the following items were abstracted into Excel forms for synthesis and evaluation: title, author, article year, country, study time frame, model’s name, model subset (if any), study type (quantitative or qualitative), study sample (number of hospitals studied or other hospital samples), evaluation term/s (performance, productivity, efficiency, effectiveness), evaluation criteria/indices, key evaluation results, and evaluation score (if any). The extracted data were summarized in related tables to address the objectives of this scoping review.
Results
Study characteristics
Eighty full-text studies (of 7402 studies) written in English were included from 2012 to September 2022 [Figure 1], approximately 50% of which were published between 2018 and 2022.
Figure 1.
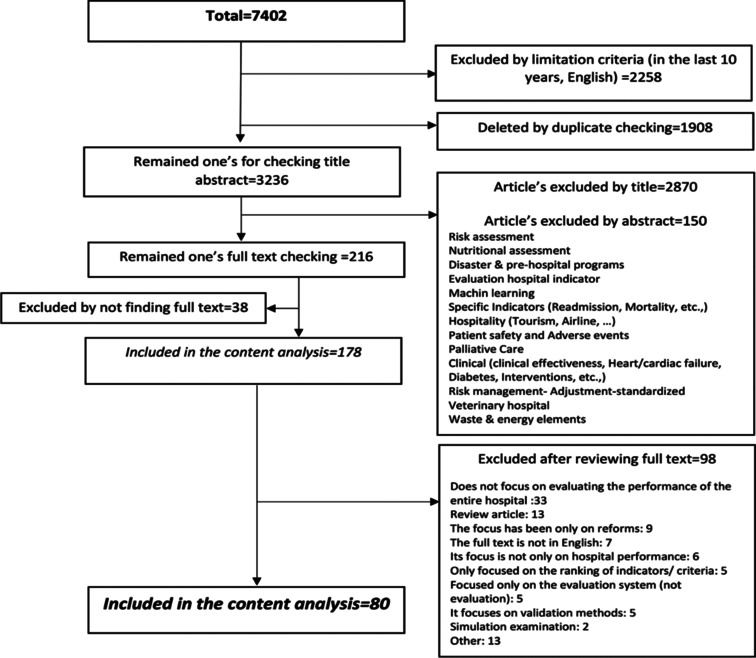
Study selection and data abstraction
The study characteristics are shown in Table 1. According to the country where the studies were conducted, 50% of the studies were conducted in Iran, USA, Brazil, and China [Table 1]. In total, approximately 25% of the studies were conducted in Iran; nine of these studies used the DEA method,[5,21,22,23,24,25,26,27,28] and most of them (12 out of 19 studies) were published between 2018 and 2021.[5,21,24,25,26,28,29,30,31,32,33,34]
Table 1.
Study characteristic
| Information | Number of studies | |||
|---|---|---|---|---|
| Publication Year | 2013-2017[22,23,27,35,36,37,38,39,40,41,42,43,44,45,46,47,48,49,50,51,52,53,54,55,56,57,58,59,60,61,62,63,64,65,66,67,68,69,70] | 39 | ||
| 2018-2022[5,21,24,25,26,28,29,30,31,32,33,34,71,72,73,74,75,76,77,78,79,80,81,82,83,84,85,86,87,88,89,90,91,92,93,94,95,96,97,98] | 41 | |||
| Number of Articles Per Country | Iran[5,21,22,23,24,25,26,27,28,29,30,31,32,33,34,35,36,38,50] | 19 | ||
| USA, Brazil, China[42,44,45,47,48,53,54,56,62,66,72,74,81,82,85,86,87,92,94,95,97] | 7 | |||
| Greece[41,43,57,64,65] | 5 | |||
| India[39,49,52,84] | 4 | |||
| Italy, Czech Republic, Romania, Turkey, Palestine, Taiwan, Philippines, Serbia, Egypt, Saudi Arabia[46,51,55,58,60,61,67,70,71,73,75,77,78,79,80,83,91,96,98,99] | 2 | |||
| Poland, New Zealand, Slovak Republic, Albania, The State of Eritrea, Portugal, Vietnam, Pakistan, Nepal, Chile, Bangladesh[37,40,59,63,68,69,76,88,89,90,93] | 1 | |||
| Hospital’s number | >=2000[70,72,82,85,94] | 5 | ||
| >=1000[21,26,36,44,48,54,63,64,65,67,87] | 11 | |||
| >=100[24,43,57,74,76,81,83,91,92] | 9 | |||
| >=50[5,22,23,25,27,28,29,30,31,33,34,35,37,38,39,40,41,42,45,46,47,49,50,51,52,53,55,56,58,59,60,61,62,66,68,69,71,73,75,77,78,79,80,84,86,89,90,91,95,97,98,99] | 52 | |||
| Not mentioned[32,88,93] | 3 | |||
| Hospital type | Public hospital (n=4797)[21,22,24,40,41,43,45,47,49,53,56,57,58,60,61,62,63,65,66,69,73,74,80,83,85,87,99] | 27 | ||
| Private hospital (n=2)[55,89] | 2 | |||
| Both private and public hospitals (n=512)[67,68,75,79] | 4 | |||
| Not mentioned public or private hospital (n=15115)[5,23,26,27,28,29,30,31,32,33,34,35,36,37,38,39,44,46,48,25,50,51,54,59,64,68,70,71,72,76,77,78,81,82,84,86,88,90,91,92,93,94,95,96,97,98,99] | 47 | |||
| Study Focus on Performance Terms | Performance[5,21,22,25,26,27,28,29,30,31,32,33,34,35,36,37,38,39,41,42,43,44,45,46,47,48,50,52,55,57,59,60,61,62,63,65,68,69,70,72,73,75,77,78,79,80,81,82,83,84,85,86,87,88,89,90,91,93,94,95,96,97,99] | 63 | ||
| Productivity[5,47,54,58,64,65,69,72,87,89,90,91,98] | 13 | |||
| Efficiency[5,21,22,23,24,28,31,37,39,40,42,43,44,45,46,47,48,49,51,52,53,54,56,57,58,60,62,63,64,65,66,67,69,70,71,72,73,74,75,76,78,81,82,83,84,85,86,89,90,91,92,95,97,98,99] | 58 | |||
| Effectiveness[5,37,79,86] | 4 | |||
| Just performance[29,30,32,33,34,35,36,38,41,50,55,59,61,68,77,80,88,93,94,96] | 20 | |||
| Just efficiency[23,24,40,49,51,53,56,66,67,71,74,76,92] | 13 | |||
| Just effectiveness | 0 | |||
| Just productivity | 0 | |||
| Performance and efficiency[21,22,25,26,27,28,31,39,42,43,44,45,46,48,52,57,60,62,63,70,73,75,78,81,82,83,84,85,95,97,99] | 31 | |||
| Performance and efficiency & Productivity[47,65,69,72,89,90,91] | 7 | |||
| Productivity and efficiency[54,58,64,98] | 4 | |||
| Performance and efficiency & Effectiveness[37,86] | 2 | |||
| Performance and effectiveness[79] | 1 | |||
| Performance and productivity[87] | 1 | |||
| Performance and efficiency & Effectiveness & Productivity[5] | 1 |
Regarding the number of hospitals, 20,404 hospitals were evaluated in 77 studies [Table 1], 33 of which focused on the performance evaluation of public or private hospitals or both. The number of hospitals was between 1 and 50 in about 70% of the studies (52 out of 77 cases).
Considering that terms related to performance are used in the literature, in almost 80% of the studies, performance has been mentioned as an evaluation term. In approximately 70% of the studies, the term ‘efficiency’ was used. The terms ‘efficiency’ and ‘effectiveness’ were considered in less than 20% of studies. In addition, a quarter of the studies focused solely on the term “performance” for hospital evaluation, and approximately 15% used the term “efficiency”. No study used only the term ‘productivity’ or ‘effectiveness’. Additionally, a combination of one to four terms was used for evaluation: ‘performance and efficiency’, ‘performance and productivity’, and ‘performance and efficiency and effectiveness’. Only one study used four evaluation terms simultaneously (‘performance, efficiency, effectiveness, and productivity’).
The hospital performance evaluation models, their categories, the methods used, and their details are presented in Table 2. In general, performance evaluation models can be divided into two main categories: quantitative and qualitative models. More than 65% of the studies focused only on quantitative models, while the rest considered both quantitative and qualitative models. Thus, the evaluation of hospital performance in all the studies included a quantitative analysis. Quantitative models were divided into two main groups: ‘parametric’ and ‘non-parametric’. Parametric models were divided into four methods: regression models, stochastic frontier analysis (SFA), neural network models, and factor analysis. Non-parametric models can be classified into five groups: data envelopment analysis (DEA) models, multi-criteria decision-making (MCDM) methods, performance management models, service quality models, and other models. Additionally, 33 studies of qualitative performance evaluation methods and quantitative models were reported using eight techniques.
Table 2.
Hospital performance evaluation models
| Model Type | Category | Model’s name | Method used | Details | ||||||
|---|---|---|---|---|---|---|---|---|---|---|
| Quantitative Models | Parametric Models | Statistical techniques[24,32,37,39,40,42,43,44,48,53,54,55,56,58,59,60,62,64,65,66,70,72,74,76,78,81,87,88,91,92,94,98,99] | Regression Models[24,37,39,40,42,43,44,48,53,54,55,56,58,59,60,62,64,65,66,70,72,74,76,78,81,87,88,91,92,94,98,99] | With DEA Model[24,39,40,43,44,48,53,54,56,58,60,62,64,65,66,72,74,76,78,81,88,91,92,98,99] | Bootstrap[43,53,65,81] | |||||
| Tobit regression[39,40,92,99,44,64,66,74,76,78,81,91] | ||||||||||
| Linear regression[24,54,58,60,64,72,88] | ||||||||||
| Truncated regression[43,81] | ||||||||||
| Lower values mean frontier regression[56,62] | ||||||||||
| Logistic regression[48] | ||||||||||
| Multiple regression analysis[98] | ||||||||||
| With other Models [37,42,55,59,70,87,94] | Linear regression Model[37,94] | |||||||||
| Logistic regression Model[37,94] | ||||||||||
| Multiple regression analysis[59] | ||||||||||
| Productivity regression[87] | ||||||||||
| Partial least-squares regression (PLSR)[42] | ||||||||||
| Partial nonparametric regression plots[70] | ||||||||||
| Structural equation model (SEM)[55] | ||||||||||
| SFA | Stochastic frontier analysis (SFA)[24,58] | |||||||||
| Neural Network Models | BP artificial neural network[42] | |||||||||
| Factor Analysis | Confirmatory factor analysis (CFA) and exploratory factor analysis (EFA) and construct validity[32] | |||||||||
| Quantitative Models | Non-Parametric Models | DEA Model[5,21,22,23,24,25,26,27,28,39,40,43,44,45,47,48,49,51,52,53,56,57,58,60,62,63,64,65,66,67,69,70,71,72,73,74,76,78,81,82,83,84,85,89,91,92,95,97,98,99] | Pre-processing DEA Models[60,63,74,85] The latent cluster class analysis and Spatial analysis to identify predominant clusters[85] Graph-based clustering algorithm and Sensibility analysis[63] Models of decreasing indices[74] |
Solver module and Visualization module and Data reader module[60] | ||||||
| Classic DEA Models[5,21,22,23,24,26,27,28,39,40,43,44,45,47,48,49,51,52,53,56,57,58,62,63,64,65,66,67,69,70,71,72,73,74,76,78,81,82,83,84,85,89,91,92,95,97,98,99] | Stage Analysis | Two-stage analysis DEA[23,40,43,44,48,57,64,66,70,72,73,78,81,82,83,91,99] | ||||||||
| Three-stage analysis DEA[53,58,84] | ||||||||||
| Four-stage-DEA method[74,92] | ||||||||||
| Orientation | Input-oriented[5,21,22,23,24,26,28,39,44,51,57,64,65,67,73,74,76,78,81,83,84,89,91,95,97] | |||||||||
| Output-oriented[21,40,45,48,49,52,56,62,63,69,71,89,95,98] | ||||||||||
| Non-oriented module/Slack-based[44,49,56,62,66] | ||||||||||
| Return to Scale | Variable returns to scale (VRS) or BCC model[21,24,27,28,39,40,43,44,45,48,52,53,57,62,64,65,71,73,76,78,81,83,84,85,89,91,95,99] | |||||||||
| Constant return to scale (CRS or CCR) Model[21,23,24,28,40,43,49,51,57,64,65,67,69,73,74,76,81,83,84,85,89,91,95,98,99] | ||||||||||
| Efficiency type | Technical efficiency[22,23,24,27,39,40,43,44,49,51,52,53,57,58,63,64,65,66,67,69,73,74,76,78,81,82,83,84,85,89,91,92,98,99] | |||||||||
| Scale efficiency (SE)[27,39,40,43,47,67,73,74,81,83,85,91,92] | ||||||||||
| Efficiency changes[47,57,64,65,69] | ||||||||||
| Allocative efficiency[40,47,51] | ||||||||||
| Economic efficiency Analysis[40,57,64] | ||||||||||
| Cross-efficiency[23,26] | ||||||||||
| Integrated efficiency[73,74,92] | ||||||||||
| Super efficiency[49,92] or ultra-efficient DEA[92] | ||||||||||
| Developed DEA Models (5,21, 24,25,26,28,47,48,56,57,62, 64–66,69,72,74,82,91,97,98) | Dynamic Evaluation Models | Malmquist productivity index (MPI)[47,57,64,65,66,69,74,91,98] | ||||||||
| Window-DEA method[65,97,98] | ||||||||||
| Dynamic network slack-based model (DNSBM)[56,62] | ||||||||||
| Multifactor productivity index change[69] | ||||||||||
| Total factor productivity (TFP) Change[47] | ||||||||||
| Fuzzy Approaches | Fuzzy credibility approach[25,97] | |||||||||
| Integrated fuzzy clustering cooperative game DEA approach[26] | ||||||||||
| Triangular single valued neutrosophic DEA (the theory of fuzzy sets) (FSs)[28] | ||||||||||
| Robust Models | Robust DEA approach[25,72] | |||||||||
| Robust credibility DEA (RCDEA) model[26] | ||||||||||
| Others | Weight restricted model[48] | |||||||||
| Ratio analysis technique[69] | ||||||||||
| DEA-R models (DEA and ratio analysis)[21] | ||||||||||
| Hybrid VRS-CRS-SFA (VCS) model[24] | ||||||||||
| DEA-EEP model measure the efficiency, effectiveness, and productivity[5] | ||||||||||
| The Latent variable frontier model (LVM)[82] | ||||||||||
| Quantitative Models[5,21,22,23,24,25,26,27,28,29,30,31,32,33,34,35,36,37,38,39,40,41,42,43,44,45,47,48,49,50,51,52,53,54,55,56,57,58,59,60,61,62,63,64,65,66,67,68,69,70,71,72,73,74,75,76,78,79,80,81,82,83,84,85,87,88,89,91,92,93,94,95,96,97,98,99] | Non-Parametric Models | Multi-Criteria Decision-Making (MCDM) Methods[29,30,31,35,42,60,61,75,79,94] | Analytic hierarchy process (AHP) methods[30,31,42,61] | |||||||
| Plithogenic multicriteria decision making (MCDM) theory[75] | ||||||||||
| Multicriteria decision making techniques (MCDMT)[31] | ||||||||||
| Fuzzy decision making trial and evaluation laboratory (DEMATEL) technique[35] | ||||||||||
| Fuzzy Comprehensive evaluations and fuzzy gray relational analyses[42] | ||||||||||
| Logical Explanations and Visualizations of Estimations in Linear Mixed Models (LEVEL)[94] | ||||||||||
| Linear programming (LP)[60] | ||||||||||
| Preference ranking organization method for enrichment evaluations (PROMETHEE II)) and Multi-attributive border approximation area comparison (MABAC) and Best worst method (BWM)[79] | ||||||||||
| Hybrid multicriteria group decision making (MCGDM) and Group best-worst method (GBWM) and fuzzy preference programming (FPP) (uncertain conditions)[29] | ||||||||||
| Performance Management[22,30,32,33,34,36,37,38,41,50,88,93,96] | Balanced score card (BSC)[30,33,37,41,88] | |||||||||
| Pabon Lasso method[22,34,50,96] | ||||||||||
| European foundation for quality management (EFQM) Model[33,38] | ||||||||||
| IPOCC approach[32,33] | ||||||||||
| Accreditation[33] | ||||||||||
| Ratio analysis technique[36] | ||||||||||
| McKinsey 7-S framework[93] | ||||||||||
| Service Quality[54,59,61,68,80] | Output unit of care (HUC) Model[54] | |||||||||
| SERVQUAL[59,61,68] | ||||||||||
| Linguistic evaluation scales parameterized by triangular fuzzy numbers (A novel fuzzy evaluation framework based on the ServQual)[61] | ||||||||||
| SERVPERF model (for patient perception analysis)[80] | ||||||||||
| Other Models (70,87) | Nonparametric conditional approach based on partial order-M frontier[70] | |||||||||
| Malmquist–luenberger (M-L) index and Total factor productivity (TFP)[87] | ||||||||||
| Qualitative Models | - | - | Questionnaires[29,30,31,32,33,36,41,42,46,59,61,68,77,80,84,88,93] | |||||||
| Interviews[32,35,41,55,59,61,75,77,83,84,88,93] | ||||||||||
| Panel data analysis[47,57,58,64,66,89,91,92,97,99] | ||||||||||
| Expert panel[32,33,35,45] | ||||||||||
| Delphi method[30] | ||||||||||
| Focus group discussions (FGD)[41] | ||||||||||
| Systematic review[35] | ||||||||||
| Scoping review[86] | ||||||||||
The findings showed that 33 out of 80 studies (40%) used parametric models, while more than 60% of the studies (50 out of 80) used the non-parametric model of DEA to evaluate performance. The DEA models used in those studies can be divided into three groups, that is, ‘preprocessing DEA models’, ‘classic DEA models’, and ‘developed DEA models’.
For classic DEA models, four methods have been mentioned in the reviewed studies: ‘stage analysis’, ‘orientation’, ‘returns to scale’, and ‘efficiency type’. Methods such as dynamic evaluation models, fuzzy approaches, and robust models have been mentioned for the developed DEA models.
In addition, there were eight types of efficiency in the classical DEA method. ‘Technical efficiency’ was reported in approximately 70% of DEA studies, with different names including ‘Pure Technical Efficiency (PTE)’,[27,43,57,64,65,69,74,81,91,92,99] ‘Average Technical Efficiency (ATE)’,[24,98] ‘Managerial Efficiency’,[27,73] ‘Operational Efficiency’,[57] ‘Program Efficiency’,[73] ‘Overall Technical Efficiency (OTE)’,[49] ‘Relative Efficiency’,[73] and ‘Technological Efficiency’.[27] Additionally, ‘Efficiency Changes’[47,57,64,65,69] were calculated as ‘Technological Change (TC)’,[47,64,65,69] ‘Technical Efficiency Changes’,[47,65,69] and ‘Scale Efficiency Changes’[57,65] in five studies. The combination of ‘Technical and Scale Efficiency’ was considered ‘Integrated Efficiency’[74] or ‘Overall Efficiency (OE)’.[73,92]
Multiple criteria decision-making methods (MCDMs) were reported in approximately 12% of the studies with nine different models. Additionally, approximately ten methods of performance management and quality improvement were presented in approximately 20% of the quantitative studies (18 out of 80 cases).
Performance management models were presented in seven different models in 13 studies, among which the ‘balanced score card (BSC)’ was reported in approximately 40% of the studies. Service quality models were reported in five studies with four different models.
It should be noted that most studies have used the results of performance analysis for ranking, scoring, or both. DEA rankings or scores were reported in more than 60% of the studies (50 of 80), while approximately 20% (19 of 80) did not report rankings or scores for performance evaluation. In addition, specific performance ranking methods other than DEA were present in less than 20% of the studies; these methods included the ‘MCDM score’,[29,75] ‘TOPSIS analysis’,[31,42] ‘BWM (for the weight of criteria) and PROMETHEE II’,(79) ‘expert opinion/panel’,[30,35] ‘league table’,[37] ‘VIKOR technique’,[75] ‘the Spearman rank correlation’,[70] ‘average technical efficiency scores’,[58] and ‘self-assessment’.[67]
Discussion
The aim of this study was to systematically review hospital performance evaluation studies to explore the scope of those studies in terms of the models used, the performance dimensions measured, and their classification. It should be noted that despite the different methods and frameworks for measuring the performance of hospitals as the major driver of healthcare costs, no consensus has been reached regarding the appropriate performance measurement approach in health services. This review identified six types of hospital performance evaluation models in 80 studies. Among the conducted studies, all studies used quantitative models for hospital evaluation, and their significant focus was on using non-parametric models.
Therefore, there has always been an endless interest in developing and using a combination of methods and frameworks, as much as possible, to measure organizational performance to provide a rounded picture of the performance of organizations.[100]
Fewer than 10% of studies in the last ten years have addressed traditional models of hospital performance evaluation, such as the BSC, Pabon Lasso, and EFQM. The point was the use of hybrid models in some of the studies conducted with these models, for example, DEA and MCDM,[60,98] DEA and Pabon Lasso,[22] BSC and EFQM and IPCOO approach and accreditation,[33] SERVQUAL and AHP,[61] and BSC and AHP.[30] In addition, 12 regression analyses were performed in 40% (32 out of 80) of the studies; approximately 80% were conducted with the DEA model, and the rest were conducted with other models.
The non-parametric DEA model was mostly used in the reviewed studies. A comparison of some of the more frequent models with the DEA model shows that each model has advantages over the others; in other words, the use of a combination of models increases the accuracy of the output results. For example, DEA introduces a model for determining weights that maximize the efficiency of decision-making units. The primary focus of the DEA model is to compare (alternative) decision units in terms of their efficiency in converting inputs into outputs. An MCDM uses a set of weights that express the decision maker’s preferences. In contrast, DEA does not provide a set of weights that can express a decision maker’s preferences. A comparison of DEA and MCDM shows that DEA is similar to MCDM, but the results are different. Despite these differences, DEA can be used as a complement to screening alternatives in MCDM.[101]
The BSC is usually used to measure performance quality, while DEA is more suitable for quantitative measurements, as DEA models can be integrated with different inputs and outputs to compare decision-making units (DMUs) simultaneously.[102] Both DEA and Pabon Lasso use a hybrid approach with hospital indicators, inputs, and outputs to calculate hospital efficiency. The use of both models provides complementary and confirmatory results, but these models should be compared with caution. DEA seems to be more effective for hospitals than the Pabon Lasso model is. While the inefficient region of Pabon Lasso is well defined, DEA does not provide such a clear limit for inefficiency. Nevertheless, both can clearly represent efficient hospitals. Moreover, both methods can use almost the same data to evaluate the performance of hospitals, which allows their comparative use.[100]
The current method of measuring service quality with SERVQUAL was limited in that there were no clear guidelines for determining who should be benchmarked and how much service quality should be improved. Since DEA measures the relative efficiency of DMUs and identifies a set of corresponding efficient DMUs, called the reference set, which can be used as a benchmark to improve inefficient DMUs, it can provide clear guidelines for benchmarking multi-unit service quality metrics.[103]
This study showed the wide applicability of the DEA model due to the dispersion of the method used in its subset (more than 30 methods). This model is a powerful modeling technique that has long been widely used[76,104] for the comparative performance evaluation of homogeneous operational units such as hospitals operating under multi-dimensional output/input performance indicator sets (85,104). In addition, this approach allows identification of the sources of inefficiency and, consequently, how it can be overcome.[105]
Additionally, according to the findings, the focus of 65% of the non-parametric models has been on the classic models of data envelopment analysis, and the use of developed models was seen in approximately 30% of the studies. Moreover, approximately half of the developed DEA models applied dynamic DEA models, of which only two studies used dynamic network models[56,62] or classic dynamic models. In the development of classic DEA models, when the production process generates intermediate outputs that serve as inputs for new processes, network DEA can be used. Thus, it is possible to consider link variables belonging to more than one dimension and generate efficiency scores for all of them. Since the dynamic–network DEA model (DN model) takes into account internal heterogeneous organizations such as hospitals, where divisions are mutually connected by link variables and trade internal products and services with each other over the entire observed term, using this model is proposed for future studies.[106] These issues necessitate the use of developed DEA models and benchmarking techniques in future studies.
Additionally, even when considering the best model, environmental factors such as the geographic location of the hospital and its expertise can affect the outcome of the hospital evaluation.[107] This choice may also affect the actual results to some extent. In addition, depending on what is being addressed from the evaluator’s perspective, the results can be different. Therefore, there is no unique model.
Limitations and recommendation
Access to the full text of the articles was the main limitation of the study. We overcome this limitation by contacting the authors individually. Moreover, 47 papers did not define hospital type information, which made it more difficult to interpret and compare the results. Additionally, although it was important to examine the scope of each article to compare the type of model and the relationship of the hospital in terms of size and type with the number and type of selected models, it was not possible to do so; this was another limitation and was outside the scope of this study. Future studies can include the type and size of hospitals when comparing the performance evaluation models used.
Conclusion
In summary, this study identified six different models for hospital performance evaluation in 80 studies that were conducted in the past ten years. The performance evaluation models of all the hospitals were classified into two categories: quantitative and qualitative models. All the studies evaluated hospital performance quantitatively. This approach adds to the necessity of scoring and ranking performance based on quantitative models.
Additionally, various studies have evaluated hospital performance by focusing on performance and efficiency terms and rarely focusing on productivity and effectiveness. Therefore, the need to consider other aspects of hospital performance when evaluating these patients is increased.
In addition, the DEA model, which has numerous increasing capabilities, has attracted the attention of researchers in recent years and has taken first place among quantitative models for evaluating hospital performance. This could be because of various options provided by this model, such as the use of dynamic functions, networks, reversals, fuzzy functions, hybrids, scoring, rankings, and so on. Different subsets of DEA models in the field of hospital performance evaluation were introduced. Considering its limitations, more attention should be given to the capabilities of the DEA model when quantitatively evaluating hospital performance. More research should be performed to compare the extracted models with real data from different hospitals and provide the most useful model according to the environmental factors of the hospital.
Conflicts of interest
There are no conflicts of interest.
Acknowledgements
The present article is part of the result of a doctoral thesis approved by Isfahan University of Medical Sciences with code 55657 (IR.MUI.NUREMA.REC.1401.005). The authors are grateful for the support of the Vice Chancellor for Research of Isfahan University of Medical Sciences.
Funding Statement
Nil.
References
- 1.Dubas-Jakóbczyk K, Kocot E, Tambor M, Quentin W. The association between hospital financial performance and the quality of care—A scoping review protocol. Syst Rev. 2021;10:221. doi: 10.1186/s13643-021-01778-3. [DOI] [PMC free article] [PubMed] [Google Scholar]
- 2.Pitocco C, Sexton TR. Measuring hospital performance using mortality rates: An alternative to the RAMR. Int J Heal Policy Manag. 2018;7:308–16. doi: 10.15171/ijhpm.2017.94. [DOI] [PMC free article] [PubMed] [Google Scholar]
- 3.Buathong S, Bangchokdee S. The use of the performance measures in Thai public hospitals. ASIAN Rev Account. 2017;25:472–85. [Google Scholar]
- 4.Meker T, Barlas Y. Dynamic Consequences of Performance-Based Payment Systems in Public Hospitals. Syst Res Behav Sci. 2015;32:459–80. [Google Scholar]
- 5.Ghahremanloo M, Hasani A, Amiri M, Hashemi-Tabatabaei M, Keshavarz-Ghorabaee M, Ustinovičius L. A novel DEA model for hospital performance evaluation based on the measurement of efficiency, effectiveness, and productivity. Eng Manag Prod Serv. 2020;12:7–19. [Google Scholar]
- 6.Kocisova K, Hass-Symotiuk M, Kludacz-Alessandri M. Use of the DEA method to verify the performance model for hospitals. E+M Ekon Manag. 2018;21:125–40. [Google Scholar]
- 7.Fanelli S, Lanza G, Zangrandi A. Management tools for quality performance improvement in Italian hospitals. Int J Public Adm. 2017;40:808–19. [Google Scholar]
- 8.Rahimi H, Bahmaei J, Shojaei P, Kavosi Z, Khavasi M. Developing a strategy map to improve public hospitals performance with balanced scorecard and DEMATEL approach. Shiraz E Med J. 2018;19:e64056. [Google Scholar]
- 9.Bahadori M, Izadi A, Ghardashi F, Ravangard R, Hosseini M. The evaluation of hospital performance in Iran: A systematic review article. Iran J Public Health. 2016;45:855–66. [PMC free article] [PubMed] [Google Scholar]
- 10.Malekzadeh R, Abedi G. Identification of effective components in hospital performance assessment: A qualitative study. J Qual Res Heal Sci. 2021;10:100–7. [Google Scholar]
- 11.Rezapour A, Foroughi Z, Sadeghi NS, Faraji M, Mazdaki A, Asiabar AS, et al. Identification of the most appropriate variables for measuring the efficiency of Iranian public hospitals: Using Delphi technique. J Educ Health Promot. 2019;8:140. doi: 10.4103/jehp.jehp_402_18. [DOI] [PMC free article] [PubMed] [Google Scholar]
- 12.Rezaei S, Hajizadeh M, Nouri B, Ahmadi S, Rezaeian S, Salimi Y, et al. Iranian hospital efficiency: A systematic review and meta-analysis. Int J Health Care Qual Assur. 2019;32:385–97. doi: 10.1108/IJHCQA-03-2018-0067. [DOI] [PubMed] [Google Scholar]
- 13.Alatawi A, Ahmed S, Niessen L, Khan J. Systematic review and meta-analysis of public hospital efficiency studies in Gulf region and selected countries in similar settings. Cost Eff Resour Alloc. 2019;17:17. doi: 10.1186/s12962-019-0185-4. [DOI] [PMC free article] [PubMed] [Google Scholar]
- 14.Masoompour SM, Petramfar P, Farhadi P, Mahdaviazad H. Five-year trend analysis of capacity utilization measures in a teaching hospital 2008-2012. Shiraz E Med J. 2015;16:e21176. [Google Scholar]
- 15.Rahati M, Asl IM, Aboulhallaje M, Jafari M. Efficiency evaluation of listed hospital companies in the capital market: Introducing a new hospital administration and financing. Int Trans J Eng Manag Appl Sci Technol. 2020:11. [Google Scholar]
- 16.Rasi V, Delgoshaee B, Maleki M. Identification of common indicators of hospital performance evaluation models: A scoping review. J Educ Health Promot. 2020;9:63. doi: 10.4103/jehp.jehp_563_19. [DOI] [PMC free article] [PubMed] [Google Scholar]
- 17.Seitio-Kgokgwe O, Gauld R, Hill P, Barnett P. Assessing performance of botswana’s public hospital system: The use of the world health organization health system performance assessment framework. Int J Heal Policy Manag. 2014;3:179–89. doi: 10.15171/ijhpm.2014.85. [DOI] [PMC free article] [PubMed] [Google Scholar]
- 18.Arksey H, O’Malley L. Scoping studies: Towards a methodological framework. Int J Soc Res Methodol. 2005;8:19–32. [Google Scholar]
- 19.Tricco AC, Lillie E, Zarin W, O’Brien KK, Colquhoun H, Levac D, et al. PRISMA extension for scoping reviews (PRISMA-ScR): Checklist and explanation. Ann Intern Med. 2018;169:467–73. doi: 10.7326/M18-0850. [DOI] [PubMed] [Google Scholar]
- 20.Pham MT, Rajić A, Greig JD, Sargeant JM, Papadopoulos A, McEwen SA. A scoping review of scoping reviews: Advancing the approach and enhancing the consistency. Res Synth Methods. 2014;5:371–85. doi: 10.1002/jrsm.1123. [DOI] [PMC free article] [PubMed] [Google Scholar]
- 21.Ghiyasi M, Soltanifar M, Sharafi H. A novel inverse DEA-R model with application in hospital efficiency. Socioecon Plann Sci. 2022;84:101427. [Google Scholar]
- 22.Mehrtak M, Yusefzadeh H, Jaafaripooyan E. Pabon lasso and data envelopment analysis: A complementary approach to hospital performance measurement. Glob J Health Sci. 2014;6:107–16. doi: 10.5539/gjhs.v6n4p107. [DOI] [PMC free article] [PubMed] [Google Scholar]
- 23.Mirmozaffari M, Alinezhad A, IEEE Ranking of heart hospitals using cross-efficiency and two-stage DEA. Proceedings of the 2017 7th International Conference on Computer and Knowledge Engineering (ICCKE) 2017:217–22. [Google Scholar]
- 24.Mirmozaffari M, Yazdani R, Shadkam E, Khalili SM, Tavassoli LS, Boskabadi A. A Novel Hybrid Parametric and Non-Parametric Optimisation Model for Average Technical Efficiency Assessment in Public Hospitals during and Post-COVID-19 Pandemic. Bioengineering (Basel) 2022;9:7. doi: 10.3390/bioengineering9010007. [DOI] [PMC free article] [PubMed] [Google Scholar]
- 25.Omrani H, Alizadeh A, Emrouznejad A, Teplova T. A robust credibility DEA model with fuzzy perturbation degree: An application to hospitals performance. Expert Syst Appl. 2022:189. [Google Scholar]
- 26.Omrani H, Shafaat K, Emrouznejad A. An integrated fuzzy clustering cooperative game data envelopment analysis model with application in hospital efficiency. Expert Syst Appl. 2018;114:615–28. [Google Scholar]
- 27.Yusefzadeh H, Ghaderi H, Bagherzade R, Barouni M. The efficiency and budgeting of public hospitals: Case study of Iran. Iran Red Crescent Med J. 2013;15:393–9. doi: 10.5812/ircmj.4742. [DOI] [PMC free article] [PubMed] [Google Scholar]
- 28.Yang W, Cai LL, Edalatpanah SA, Smarandache F. Triangular single valued neutrosophic data envelopment analysis: Application to hospital performance measurement. Symmetry Basel. 2020;12:588. [Google Scholar]
- 29.Amiri M, Hashemi-Tabatabaei M, Ghahremanloo M, Keshavarz-Ghorabaee M, Zavadskas EK, Antucheviciene J. A new fuzzy approach based on BWM and fuzzy preference programming for hospital performance evaluation: A case study. Appl Soft Comput. 2020;92:106279. [Google Scholar]
- 30.Hooshmand E, Niat HZ, Ebrahimipour H, Esmaili H, Najar A V. Designing a performance evaluation model based on balanced score card and analytic hierarchy process methods: Montaserieh hospital. Health scope. 2018;7:e80342. [Google Scholar]
- 31.Jafari M, Seyedjavadi M, Zaboli R. Assessment of performance in teaching hospitals: Using multicriteria decision-making techniques. J Educ Health Promot. 2020;9:214. doi: 10.4103/jehp.jehp_89_20. [DOI] [PMC free article] [PubMed] [Google Scholar]
- 32.Malekzadeh R, Abedi G, Hasanpoor E, Ghasemi M, Mahmoodi G. A Hospital performance assessment model using the IPOCC approach. Ethiop J Health Sci. 2021;31:533–42. doi: 10.4314/ejhs.v31i3.10. [DOI] [PMC free article] [PubMed] [Google Scholar]
- 33.Malekzadeh R, Mahmoodi G, Abedi G. A comparison of three models of hospital performance assessment using IPOCC approach. Ethiop J Health Sci. 2019;29:543–50. doi: 10.4314/ejhs.v29i5.3. [DOI] [PMC free article] [PubMed] [Google Scholar]
- 34.Roshani M, Ghorbani Kalkhajeh S, Raadabadi M. Low efficiency in a five-year hospital performance assessment according to pabon lasso model: State-affiliated hospitals of Abadan. Hosp Top. 2022;100:8–15. doi: 10.1080/00185868.2021.1901065. [DOI] [PubMed] [Google Scholar]
- 35.Afsharkazemi MA, Manouchehri J, Salarifar M, Nasiripour AA. Key factors affecting the hospital performance: A qualitative study using fuzzy logic. Qual Quant. 2013;47:3559–73. [Google Scholar]
- 36.Bastani P, Vatankhah S, Salehi M. Performance Ratio Analysis: A national study on iranian hospitals affiliated to ministry of health and medical education. Iran J Public Health. 2013;42:876–82. [PMC free article] [PubMed] [Google Scholar]
- 37.Davis P, Milne B, Parker K, Hider P, Lay-Yee R, Cumming J, et al. Efficiency, effectiveness, equity (E-3). Evaluating hospital performance in three dimensions. Health Policy (New York) 2013;112:19–27. doi: 10.1016/j.healthpol.2013.02.008. [DOI] [PubMed] [Google Scholar]
- 38.Hatam N, Kohpeyma V, Kavosi Z, Kharazmi E. Self assessment of Motahari hospital, Jahrom, Iran based on European foundation for quality management (EFQM) model. World Appl Sci J. 2013;28:1662–8. [Google Scholar]
- 39.Jat TR, Sebastian MS. Technical efficiency of public district hospitals in Madhya Pradesh, India: A data envelopment analysis. Glob Health Action. 2013;6:21742. doi: 10.3402/gha.v6i0.21742. [DOI] [PMC free article] [PubMed] [Google Scholar]
- 40.Kirigia JM, Asbu EZ. Technical and scale efficiency of public community hospitals in Eritrea: An exploratory study. Health Econ Rev. 2013;3:1–16. doi: 10.1186/2191-1991-3-6. [DOI] [PMC free article] [PubMed] [Google Scholar]
- 41.Koumpouros Y. Balanced scorecard: Application in the general panarcadian hospital of Tripolis, Greece. Int J Health Care Qual Assur. 2013;26:286–307. doi: 10.1108/09526861311319546. [DOI] [PubMed] [Google Scholar]
- 42.Li CH, Yu CH. Performance evaluation of public non-profit hospitals using a BP artificial neural network: The case of hubei province in China. Int J Environ Res Public Health. 2013;10:3619–33. doi: 10.3390/ijerph10083619. [DOI] [PMC free article] [PubMed] [Google Scholar]
- 43.Mitropoulos P, Mitropoulos I, Sissouras A. Managing for efficiency in health care: The case of Greek public hospitals. Eur J Heal Econ. 2013;14:929–38. doi: 10.1007/s10198-012-0437-0. [DOI] [PubMed] [Google Scholar]
- 44.Nayar P, Ozcan YA, Yu F, Nguyen AT. Benchmarking urban acute care hospitals: Efficiency and quality perspectives. Health Care Manage Rev. 2013;38:137–45. doi: 10.1097/HMR.0b013e3182527a4c. [DOI] [PubMed] [Google Scholar]
- 45.De Souza AA, Moreira DR, Avelar EA, De Faria Marques AM, Lara AL. Data envelopment analysis of efficiency in hospital organisations. Int J Bus Innov Res. 2014;8:316–32. [Google Scholar]
- 46.Karadayi MA, Karsak EE. Lecture Notes in Engineering and Computer Science. Industrial Engineering, Galatasaray University; Ortakoy, Istanbul 34357, Turkey: 2014. Imprecise DEA framework for evaluating the efficiency of state hospitals in Istanbul; pp. 1018–23. [Google Scholar]
- 47.Li H, Dong S, Liu T. Relative efficiency and productivity: A preliminary exploration of public hospitals in Beijing, China. BMC Health Serv Res. 2014;14:158. doi: 10.1186/1472-6963-14-158. [DOI] [PMC free article] [PubMed] [Google Scholar]
- 48.Lobo MSC, Ozcan YA, Lins MPE, Silva ACM, Fiszman R. Teaching hospitals in Brazil: Findings on determinants for efficiency. Int J Healthc Manag. 2014;7:60–8. [Google Scholar]
- 49.Mogha SK, Yadav SP, Singh SP. New slack model based efficiency assessment of public sector hospitals of Uttarakhand: State of India. Int J Syst Assur Eng Manag. 2014;5:32–42. [Google Scholar]
- 50.Mohammadi M, Ziapoor A, Mahboubi M, Faroukhi A, Amani N, Pour FH, et al. Performance evaluation of hospitals under supervision of Kermanshah medical sciences using pabonlasoty diagram of a five-year period (2008-2012) Life Sci J. 2014;11:77–81. [Google Scholar]
- 51.Vaňková I, Vrabková I. The factors influencing economic efficiency of the hospital bed care in terms of the regional allowance organizations. Rev Econ Perspect. 2014;14:233–48. [Google Scholar]
- 52.Prakash V, Annapoorni D. Performance evaluation o f public hospitals in Tamil Nadu: DEA approach. J Health Manag. 2015;17:417–24. [Google Scholar]
- 53.Li H, Dong SP. Measuring and benchmarking technical efficiency of public hospitals in Tianjin, China: A bootstrap-data envelopment analysis approach. Inquiry. 2015;52:0046958015605487. doi: 10.1177/0046958015605487. [DOI] [PMC free article] [PubMed] [Google Scholar]
- 54.Das S, Boodhoo S. An activity based approach for measuring a hospital’s output units of care. IIE Trans Healthc Syst Eng. 2015;5:89–100. [Google Scholar]
- 55.Bautista JMS, Tangsoc JC. Hospital service quality assessment and analysis: A multi-perspective approach. DLSU Bus Econ Rev. 2016;26:30–49. [Google Scholar]
- 56.de Castro Lobo MS, de Castro Rodrigues H, André ECG, de Azeredo JA, Lins MPE. Dynamic network data envelopment analysis for university hospitals evaluation. Rev Saude Publica. 2016:50. doi: 10.1590/S1518-8787.2016050006022. [DOI] [PMC free article] [PubMed] [Google Scholar]
- 57.Fragkiadakis G, Doumpos M, Zopounidis C, Germain C. Operational and economic efficiency analysis of public hospitals in Greece. Ann Oper Res. 2016;247:787–806. [Google Scholar]
- 58.Hamidi S. Measuring efficiency of governmental hospitals in Palestine using stochastic frontier analysis. Cost Eff Resour Alloc. 2016;14:3. doi: 10.1186/s12962-016-0052-5. [DOI] [PMC free article] [PubMed] [Google Scholar]
- 59.Kalaja R, Myshketa R, Scalera F. Service quality assessment in health care sector: The case of Durres public hospital. In: Ozsahin M, editor. 12th International Strategic Management Conference, ISMC 2016. Vol. 235. 2016. pp. 557–65. [Google Scholar]
- 60.Li RC, Tangsoc JC, See SL, Cantor VJM, Tan MLL, Yu RJS. A DEA-based performance measurement mathematical model and software application system applied to public hospitals in the Philippines. DLSU Bus Econ Rev. 2016;25:166–86. [Google Scholar]
- 61.Lupo T. A fuzzy framework to evaluate service quality in the healthcare industry: An empirical case of public hospital service evaluation in Sicily. Appl Soft Comput. 2016;40:468–78. [Google Scholar]
- 62.Lobo MSD, Rodrigues HD, Andre ECG, de Azeredo JA, Lins MPE. Dynamic network data envelopment analysis for university hospitals evaluation. Rev Saude Publica. 2016;50:22. doi: 10.1590/S1518-8787.2016050006022. [DOI] [PMC free article] [PubMed] [Google Scholar]
- 63.Villalobos-Cid M, Chacón M, Zitko P, Inostroza-Ponta M. A new strategy to evaluate technical efficiency in hospitals using homogeneous groups of casemix: How to evaluate when there is not DRGs? J Med Syst. 2016;40:1–12. doi: 10.1007/s10916-016-0458-9. [DOI] [PubMed] [Google Scholar]
- 64.Xenos P, Yfantopoulos J, Nektarios M, Polyzos N, Tinios P, Constantopoulos A. Efficiency and productivity assessment of public hospitals in Greece during the crisis period 2009-2012. Cost Eff Resour Alloc. 2017;15:6. doi: 10.1186/s12962-017-0068-5. [DOI] [PMC free article] [PubMed] [Google Scholar]
- 65.Flokou A, Aletras V, Niakas D. Awindow-DEA based efficiency evaluation of the public hospital sector in Greece during the 5-year economic crisis. PLoS One. 2017;12:e0177946. doi: 10.1371/journal.pone.0177946. [DOI] [PMC free article] [PubMed] [Google Scholar]
- 66.Guo HAN, Zhao Y, Niu T, Tsui KL. Hong Kong Hospital Authority resource efficiency evaluation: Via a novel DEA-Malmquist model and Tobit regression model. PLoS One. 2017;12:e0184211. doi: 10.1371/journal.pone.0184211. [DOI] [PMC free article] [PubMed] [Google Scholar]
- 67.Ho CC, Chen MS, Jiang YB. The Healthcare Quality and Performance Evaluation of Hospitals with Different Ownerships-Demonstrated by Taiwan Hospitals. In: Li Q, Wang L, Zhou M, Sun L, Qiu S, Liu H, editors. 2017 10th International Congress on Image and Signal Processing, Biomedical Engineering and Informatics (CISP-BMEI) 2017. [Google Scholar]
- 68.Shafiq M, Naeem MA, Munawar Z, Fatima I. Service quality assessment of hospitals in asian context: An empirical evidence from Pakistan. Inquiry. 2017;54:46958017714664. doi: 10.1177/0046958017714664. [DOI] [PMC free article] [PubMed] [Google Scholar]
- 69.Silwal PR, Ashton T. Productivity of public hospitals in Nepal: A data envelopment analysis. BMJ Open. 2017;7:e015327. doi: 10.1136/bmjopen-2016-015327. [DOI] [PMC free article] [PubMed] [Google Scholar]
- 70.Varabyova Y, Blankart CR, Torbica A, Schreyogg J. Comparing the efficiency of hospitals in Italy and Germany: Nonparametric conditional approach based on partial frontier. Health Care Manag Sci. 2017;20:379–94. doi: 10.1007/s10729-016-9359-1. [DOI] [PubMed] [Google Scholar]
- 71.Alam T. Evaluating efficiency of hospitals in the Kingdom of Saudi Arabia: DEA-an operational research technique approach. Int J Mech Eng Technol. 2018;9:1400–5. [Google Scholar]
- 72.Leleu H, Al-Amin M, Rosko M, Valdmanis VG. A robust analysis of hospital efficiency and factors affecting variability. Heal Serv Manag Res. 2018;31:33–42. doi: 10.1177/0951484817730537. [DOI] [PubMed] [Google Scholar]
- 73.Sultan WIM, Crispim J. Are public hospitals reforming efficiently in West Bank? Confl Health. 2018;12:44. doi: 10.1186/s13031-018-0180-y. [DOI] [PMC free article] [PubMed] [Google Scholar]
- 74.Zheng WH, Sun H, Zhang PL, Zhou GJ, Jin QY, Lu XQ. A four-stage DEA-based efficiency evaluation of public hospitals in China after the implementation of new medical reforms. PLoS One. 2018;13:e0203780. doi: 10.1371/journal.pone.0203780. [DOI] [PMC free article] [PubMed] [Google Scholar]
- 75.Abdel-Basset M, El-hoseny M, Gamal A, Smarandache F. A novel model for evaluation Hospital medical care systems based on plithogenic sets. Artif Intell Med. 2019;100:101710. doi: 10.1016/j.artmed.2019.101710. [DOI] [PubMed] [Google Scholar]
- 76.Ahmed S, Hasan MZ, Laokri S, Jannat Z, Ahmed MW, Dorin F, et al. Technical efficiency of public district hospitals in Bangladesh: A data envelopment analysis. Cost Eff Resour Alloc. 2019;17:15. doi: 10.1186/s12962-019-0183-6. [DOI] [PMC free article] [PubMed] [Google Scholar]
- 77.Duran A, Chanturidze T, Gheorghe A, Moreno A. Assessment of public hospital governance in Romania: Lessons from 10 case studies. Int J Heal Policy Manag. 2019;8:199–210. doi: 10.15171/ijhpm.2018.120. [DOI] [PMC free article] [PubMed] [Google Scholar]
- 78.Ilgun G, Konca M. Assessment of efficiency levels of training and research hospitals in Turkey and the factors affecting their efficiencies. Health Policy Technol. 2019;8:343–8. [Google Scholar]
- 79.Nabeeh NA, Abdel-Monem A, Abdelmouty A. A novel methodology for assessment of hospital service according to BWM, MABAC, promethee II. Neutrosophic Sets Syst. 2019;31:63–79. [Google Scholar]
- 80.Ploscaru CC, Popescu D V, Rotea CS, Logofatu M. Study on performance evaluation of services provided in a public hospital. In: Dinu V, editor. 2019 Basiq International Conference: New Trends in Sustainable Business and Consumption. 2019. pp. 35–43. [Google Scholar]
- 81.Saquetto TC, Araujo CAS. Efficiency evaluation of private hospitals in Brazil: A two-stage analysis. Rev Adm Mackenzie. 2019;20:1–32. [Google Scholar]
- 82.Adelman D. An efficient frontier approach to scoring and ranking hospital performance. Oper Res. 2020;68:762–92. [Google Scholar]
- 83.Alatawi AD, Niessen LW, Khan JAM. Efficiency evaluation of public hospitals in Saudi Arabia: An application of data envelopment analysis. BMJ Open. 2020;10:e031924. doi: 10.1136/bmjopen-2019-031924. [DOI] [PMC free article] [PubMed] [Google Scholar]
- 84.Barpanda S, Sreekumar N. Performance analysis of hospitals in Kerala using data envelopment analysis model. J Health Manag. 2020;22:25–40. [Google Scholar]
- 85.Botega LD, Andrade M V, Guedes GR. Brazilian hospitals’ performance: An assessment of the unified health system (SUS) Health Care Manag Sci. 2020;23:443–52. doi: 10.1007/s10729-020-09505-5. [DOI] [PubMed] [Google Scholar]
- 86.Craig KJT, McKillop MM, Huang HT, George J, Punwani ES, Rhee KB. US hospital performance methodologies: A scoping review to identify opportunities for crossing the quality chasm. BMC Health Serv Res. 2020;20:640. doi: 10.1186/s12913-020-05503-z. [DOI] [PMC free article] [PubMed] [Google Scholar]
- 87.Du J, Cui S, Gao H. Assessing productivity development of public hospitals: A case study of Shanghai, China. Int J Environ Res Public Health. 2020;17:1–9. doi: 10.3390/ijerph17186763. [DOI] [PMC free article] [PubMed] [Google Scholar]
- 88.Pham C, Vu S, PHAM Y, Vu N. Evaluating performance of vietnamese public hospitals based on balanced scorecard. J Asian Financ Econ Bus. 2020;7:339–49. [Google Scholar]
- 89.Jaskova D. Efficiency of management processes in a private hospital. Entrep Sustain Issues. 2021;9:436–46. [Google Scholar]
- 90.Matos R, Ferreira D, Pedro MI. Economic analysis of portuguese public hospitals through the construction of quality, efficiency, access, and financial related composite indicators. Soc Indic Res. 2021;157:361–92. doi: 10.1007/s11205-021-02650-6. [DOI] [PMC free article] [PubMed] [Google Scholar]
- 91.Medarevic A, Vukovic D. Efficiency and productivity of public hospitals in Serbia using DEA-malmquist model and tobit regression model, 2015–2019. Int J Environ Res Public Health. 2021;18:12475. doi: 10.3390/ijerph182312475. [DOI] [PMC free article] [PubMed] [Google Scholar]
- 92.Yang Y, Xue WJ, Liu J. Efficiency evaluation of county-level public hospitals in Hainan, China: A four-stage data envelope analysis model based on panel data. Chin Med J (Engl) 2021;134:876–8. doi: 10.1097/CM9.0000000000001293. [DOI] [PMC free article] [PubMed] [Google Scholar]
- 93.Chmielewska M, Stokwiszewski J, Markowska J, Hermanowski T. Evaluating organizational performance of public hospitals using the McKinsey 7-S framework. BMC Health Serv Res. 2022;22:7. doi: 10.1186/s12913-021-07402-3. [DOI] [PMC free article] [PubMed] [Google Scholar]
- 94.Enumah SJ, Resnick AS, Chang DC. Association of measured quality with financial health among U.S. hospitals. PLoS One. 2022;17:e0266696. doi: 10.1371/journal.pone.0266696. [DOI] [PMC free article] [PubMed] [Google Scholar]
- 95.Guerra M, Morgan BF, Alves MCD. Financial performance and profile of Brazilian hospitals. J Health Manag. 2022;24:175–86. [Google Scholar]
- 96.Medarević A. Performance evaluation of general public hospitals in territories of the Former Yugoslavia: An ecological study using the Pabon Lasso model. Int J Health Plann Manage. 2022;37:2106–21. doi: 10.1002/hpm.3453. [DOI] [PubMed] [Google Scholar]
- 97.Peykani P, Memar-Masjed E, Arabjazi N, Mirmozaffari M. Dynamic performance assessment of hospitals by applying credibility-based fuzzy window data envelopment analysis. Healthcare. 2022;10:876. doi: 10.3390/healthcare10050876. [DOI] [PMC free article] [PubMed] [Google Scholar]
- 98.Vaňková I, Vrabková I. Productivity analysis of regional-level hospital care in the Czech Republic and Slovak Republic. BMC Health Serv Res. 2022;22:180. doi: 10.1186/s12913-022-07471-y. [DOI] [PMC free article] [PubMed] [Google Scholar]
- 99.Lin CS, Chiu CM, Huang YC, Lang HC, Chen MS. Evaluating the operational efficiency and quality of tertiary hospitals in Taiwan: The application of the EBITDA indicator to the DEA method and TOBIT regression. Healthcare. 2022;10:58. doi: 10.3390/healthcare10010058. [DOI] [PMC free article] [PubMed] [Google Scholar]
- 100.Mehrtak M, Yusefzadeh H, Jaafaripooyan E. Pabon lasso and data envelopment analysis: A complementary approach to hospital performance measurement. Glob J Health Sci. 2014;6:34689. doi: 10.5539/gjhs.v6n4p107. [DOI] [PMC free article] [PubMed] [Google Scholar]
- 101.Opricovic S, Tzeng GH. Multi-Objective Programming and Goal Programming. Advances in Soft Computing, vol 21. Springer; Berlin, Heidelberg: 2003. Comparing DEA and MCDM Method; pp. 227–32. [Google Scholar]
- 102.Abedian M, Amindoust A, Maddahi R, Jouzdani J. Manager perceptions of decision-making for evaluation indicators: A centralized data envelopment analysis based approach. J Model Manag. 2022;18:616–34. [Google Scholar]
- 103.Lee H, Kim C. A DEA-SERVQUAL approach to measurement and benchmarking of service quality. Procedia Soc Behav Sci. 2012;40:756–62. [Google Scholar]
- 104.Aksezer CS. A nonparametric approach for optimal reliability allocation in health services. Int J Qual Reliab Manag. 2016;33:284–94. [Google Scholar]
- 105.Galloa AJO, Ramírez CA. Evaluating Colombian public hospitals productivity during 2004-2015. A luenberger-indicator approach. Rev Gerenc Polit Salud. 2020;19:1–23. [Google Scholar]
- 106.Kawaguchi H, Tone K, Tsutsui M. Estimation of the efficiency of Japanese hospitals using a dynamic and network data envelopment analysis model. Health Care Manag Sci. 2014;17:101–12. doi: 10.1007/s10729-013-9248-9. [DOI] [PMC free article] [PubMed] [Google Scholar]
- 107.Hajduová Z, Herbrik G, Beslerová S. Application of DEA in the environment of Slovak hospitals. Invest Manag Financ Innov. 2015;12:148–53. [Google Scholar]