
FIGURE 2.
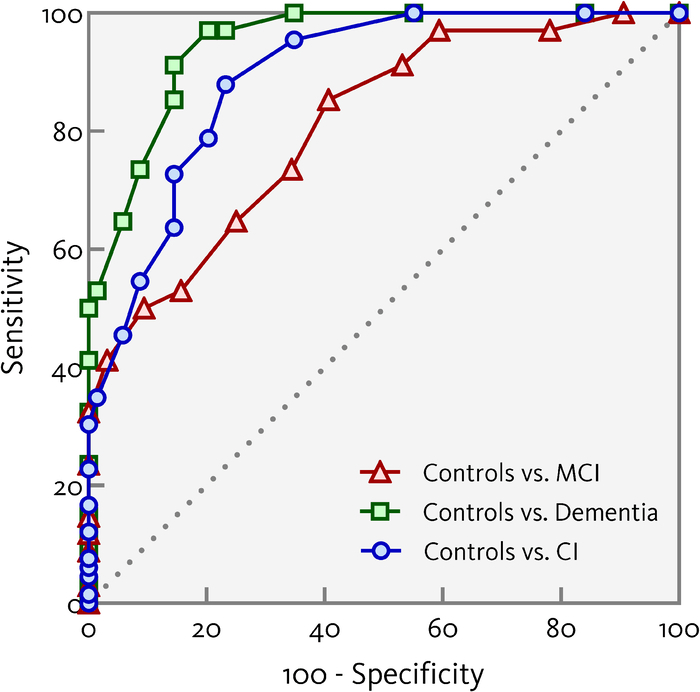
Receiver operating characteristics curves showing the sensitivity and specificity for controls versus the mild cognitive impairment (MCI) and dementia groups, and for controls versus cognitively impaired (CI; taking the MCI and dementia groups together), using the SAGE total score (uncorrected for age or education level).