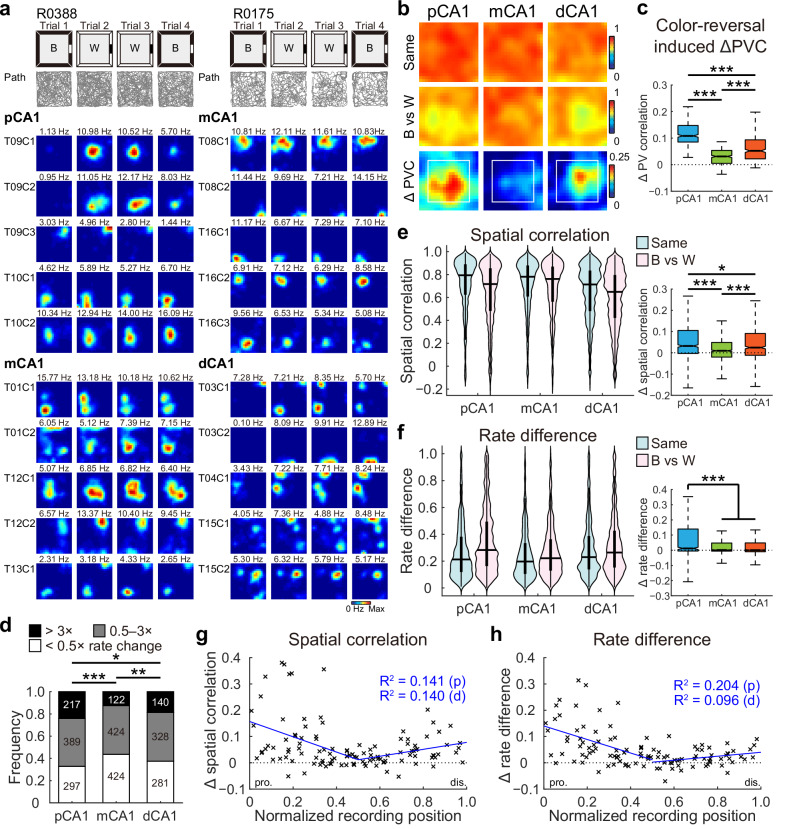
Fig. 2. V-shaped population response to reversed wall color across CA1 subdivisions.
a Representative rate maps from simultaneously recorded CA1 neurons in two separate color-reversal experiments. Left: pCA1 and mCA1 place cells recorded from rat R0388. Right: mCA1 and dCA1 place cells recorded from rat R0175. Gray lines indicate the trajectories of the animal in each trial. B, black; W, white version of the same box. Note, mCA1 showed a minimum response to the color change. b Heatmaps showing PVC of all putative pyramidal neurons recorded from each CA1 subregion between color conditions (top two rows), and changes in PVC between condition pairs (bottom row) in the color-reversal task. Note, mCA1 exhibited the lowest activity changes. Reduction in PVC is stronger for spatial bins ≥15 cm from arena walls (within the white box), where the color was manipulated. c Degree of changes in PVC between condition pairs, with outliers omitted. Place cells in mCA1 exhibited the least activity change. pCA1: 0.108 (0.085–0.147), mCA1: 0.031 (0.005–0.054), and dCA1: 0.052 (0.022–0.094); Kruskal–Wallis test, H = 541.211, P < 0.001, η2 = 0.450, n = 1200 bins, Holm–Bonferroni post hoc tests, ***P < 0.001. d Distribution of rate-remapped neurons between black and white color conditions across three CA1 bands. Numbers indicate active place cells in each category. Proportion of strongly remapped cells: pCA1, 24.03%, mCA1, 12.58%, and dCA1, 18.69%, chi-square test, χ2 = 41.214, P < 0.001; Cramer’s V = 0.125; Holm–Bonferroni post hoc tests, *P < 0.05, **P < 0.01, ***P < 0.001. e Left: distributions of SC in CA1 subregions between matching (Same) and color-reversed (B vs W) conditions. Horizontal line indicates median, and thick vertical bar indicates interquartile range (IQR, 25%–75% percentile) of each subregion. Two-way repeated-measures ANOVA, color: F (1, 2619) = 262.113, P < 0.001, η2 = 0.091; band: F (2, 2619) = 26.679, P < 0.001, η2 = 0.020; color × band: F (2, 2619) = 28.724, P < 0.001, η2 = 0.021. Right: changes in SC between condition pairs, with outliers omitted. pCA1: 0.032 (−0.003 to 0.106), mCA1: 0.010 (−0.020 to 0.049), and dCA1: 0.025 (−0.011 to 0.091); Kruskal–Wallis test, n = 2622 cells, H = 68.492, P < 0.001, η2 = 0.026; Holm–Bonferroni post hoc tests, *P < 0.05; ***P < 0.001. f Similar to (e) but showing changes in RD across CA1 subdivisions. Left: color: F (1, 2619) = 288.514, P < 0.001, η2 = 0.099; band: F (2, 2619) = 20.373, P < 0.001, η2 = 0.015; color × band: F (2, 2619) = 41.298, P < 0.001, η2 = 0.031. Right: pCA1: 0.012 (−0.005 to 0.140), mCA1: 0.001 (−0.006 to 0.047), and dCA1: 0.001 (−0.010 to 0.048); H = 38.540, P < 0.001, η2 = 0.014; post hoc tests, ***P < 0.001. g Changes in SC between condition pairs as a function of tetrode position. Each cross corresponds to the average data of a single tetrode. Blue curve, linear regression; red curve, quadratic polynomial regression. Explained variances (R2) are indicated with the same color code. pro. proximal end, dis. distal end, p proximal half, d distal half. Proximal half: r = −0.375, P = 0.002, Pearson correlation, n = 63 tetrodes; distal half: r = 0.374, P = 0.007, n = 50 tetrodes. h Similar to G but showing correlations between tetrode position and changes in RD between condition pairs. Proximal half: r = −0.452, P < 0.001; distal half: r = 0.314, P = 0.029.

