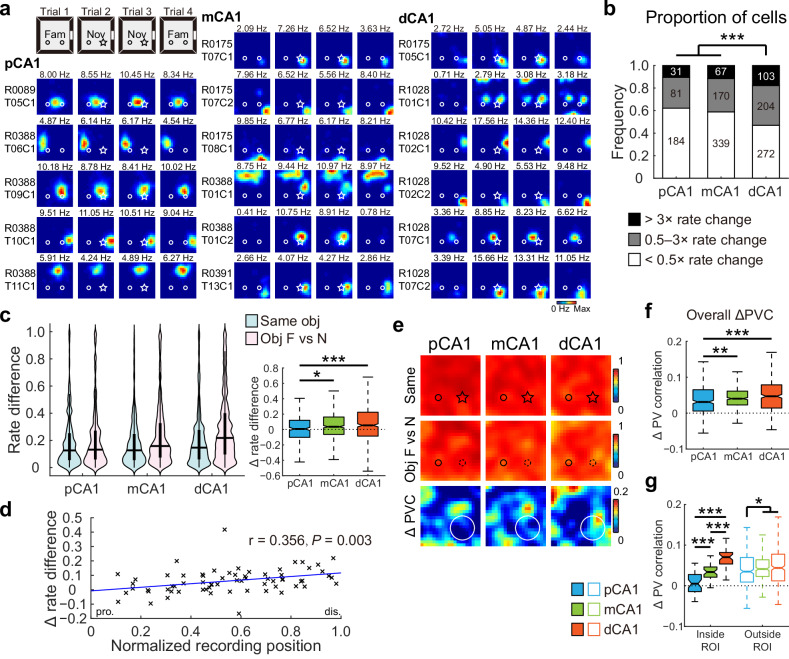
Fig. 4. Distal CA1 preferentially represented changes in object identity.
a Representative neurons in proximal, middle, and distal bands of CA1, showing remapping to the novel object. The circle and star represent familiar and novel objects, respectively. Fam, trial with two familiar objects; Nov, trial with the right object replaced with a novel object. b Distribution of neurons in response to the novel object across three CA1 bands. Proportion of cells responsive to object-replacement: pCA1, 37.84%, mCA1, 41.15%, and dCA1, 53.02%; chi-square test, χ2 = 24.602, P < 0.001, Cramer’s V = 0.130; Holm–Bonferroni post hoc tests, ***P < 0.001. c Left: distributions of RD in CA1 subregions between trials with a novel object (Same) and trials before and after object replacement (Obj F vs N). Two-way repeated-measures ANOVA, novelty F (1, 1448) = 58.170, P < 0.001, η2 = 0.039; band: F (2, 1448) = 10.527, P < 0.001, η2 = 0.014; novelty × band: F (2, 1448) = 6.169, P = 0.002, η2 = 0.008. Right: changes in RD between condition pairs, with outliers omitted. pCA1, 0.008 (−0.101 to 0.120), mCA1, 0.036 (−0.064 to 0.162), and dCA1, 0.054 (−0.085 to 0.225); Kruskal–Wallis test, n = 1451 cells, H = 13.604, P = 0.001, η2 = 0.008; Holm–Bonferroni post hoc tests, *P < 0.05; ***P < 0.001. d Pearson correlation between tetrode position and changes in RD between condition pairs (n = 67 tetrodes). Each cross corresponds to the average data of a single tetrode. Blue curve, linear regression; red curve, quadratic polynomial regression. e Heatmaps showing PVCs of all putative pyramidal neurons recorded from each subregion between trials (top two rows), as well as changes in PVC between trial pairs (bottom row) in the object-replacement task. Small circle and star represent familiar and novel objects, respectively; the large circle indicates region of the novel object. f Degree of changes in overall PVC between trial pairs across CA1 bands, with outliers omitted. pCA1, 0.031 (0.006–0.065), mCA1, 0.040 (0.023–0.061), and dCA1, 0.047 (0.014–0.079); Kruskal–Wallis test, H = 19.995, P < 0.001, η2 = 0.015, n = 1200 bins; Holm–Bonferroni post hoc tests, **P ≤ 0.01; ***P ≤ 0.001. g Degree of changes in PVC inside and outside ROI between trial pairs across CA1 bands, with outliers omitted. Bins inside ROI: pCA1, 0.005 (−0.014–0.028), mCA1, 0.034 (0.021–0.046), and dCA1, 0.070 (0.053–0.082). Bins outside ROI: pCA1, 0.035 (0.009–0.069), mCA1, 0.041 (0.023–0.064), and dCA1, 0.044 (0.012–0.078); Population responses inside and outside ROI were nearly significantly different: two-way ANOVA: band: F (2, 796) = 30.240, P < 0.001, η2 = 0.071; ROI: F (1, 398) = 3.681, P = 0.056, η2 = 0.009; band × ROI: F (2, 796) = 17.478, P < 0.001, η2 = 0.042. Holm–Bonferroni post hoc tests across CA1 subregions, *P < 0.05; ***P ≤ 0.001.

