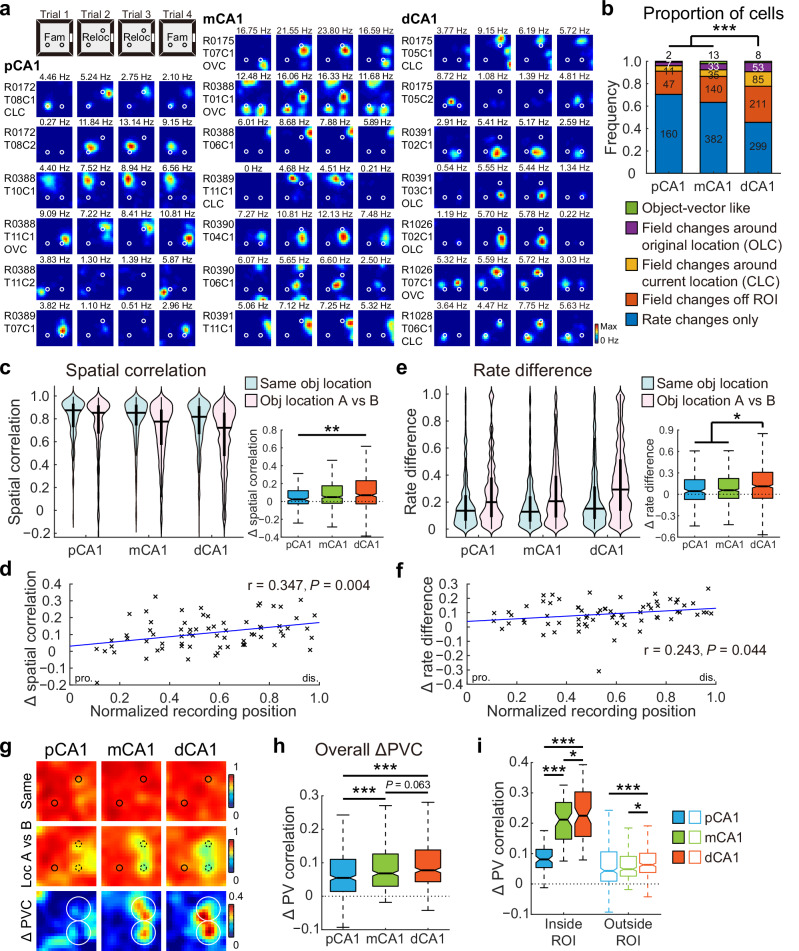
Fig. 5. Object translocation induced a stronger population response in dCA1.
a Representative neurons in proximal, middle, and distal bands of CA1, showing responses to object displacement. Circles represent objects. Fam, objects in familiar locations; Reloc, trial with the right object relocated. b Distribution of neurons in response to object translocation across three CA1 bands. Proportion of cells that showed field changes to the translocation: pCA1, 29.52%, mCA1, 36.65%, and dCA1, 54.42%; chi-square test, χ2 = 61.433, P < 0.001, Cramer’s V = 0.203; Holm–Bonferroni post hoc tests, ***P < 0.001. Subgroups: OVC-like neurons, Fisher’s exact test, P = 0.338; other relocation-responsive cells, chi-square test, all P < 0.05. c Left: distribution of SC in CA1 subregions between trials with relocated objects (Same obj location) and trials before and after object relocation (Obj location A vs B). Two-way repeated-measures ANOVA, relocation: F (1, 1483) = 153.986, P < 0.001, η2 = 0.094; band: F (2, 1483) = 21.400, P < 0.001, η2 = 0.028; relocation × band: F (2, 1483) = 4.917, P = 0.007, η2 = 0.007. Right: degree of changes in SC between condition pairs, with outliers omitted. pCA1, 0.024 (−0.026 to 0.121), mCA1, 0.049 (−0.021 to 0.175), and dCA1, 0.069 (−0.027 to 0.233); Kruskal–Wallis test, n = 1486 cells, H = 10.123, P = 0.006, η² = 0.007; Holm–Bonferroni post hoc tests, **P < 0.01. d Pearson correlation between recording position and changes in SC between condition pairs (69 tetrodes). Each cross corresponds to the average data of a single tetrode. Blue curve, linear regression; red curve, quadratic polynomial regression. e Similar to C but showing changes in RD across CA1 subdivisions. Left: relocation: F (1, 1483) = 147.858, P < 0.001, η2 = 0.091; band: F (2, 1483) = 20.702, P < 0.001, η2 = 0.027; relocation × band: F (2, 1483) = 2.609, P = 0.074, η2 = 0.004. Right: pCA1, 0.044 (−0.073 to 0.205), mCA1, 0.057 (−0.057 to 0.221), and dCA1, 0.112 (−0.056 to 0.308); H = 9.346, P = 0.009, η2 = 0.005; post hoc tests, *P < 0.05. f Similar to D but showing correlations between tetrode position and changes in RD between condition pairs. g Heatmaps showing PVCs of all putative pyramidal neurons recorded from each subregion between trials (top two rows), as well as changes in PVC between trial pairs (bottom row) in object-relocation task. Small circles represent objects, large circles indicate the target region. h Degree of changes in overall PVC between trial pairs across CA1 bands, with outliers omitted. pCA1, 0.055 (0.014–0.111), mCA1, 0.068 (0.030–0.127), dCA1, 0.077 (0.043–0.138); Kruskal–Wallis test, H = 44.493, P < 0.001, η2 = 0.035, n = 1200 bins; Holm–Bonferroni post hoc tests, ***P ≤ 0.001. i Degree of changes in PVC inside and outside ROI between trial pairs across CA1 bands, with outliers omitted. Bins inside ROI: pCA1, 0.081 (0.054–0.114), mCA1, 0.212 (0.147–0.269), and dCA1, 0.225 (0.155–0.303). Bins outside ROI: pCA1, 0.043 (0.009–0.106), mCA1, 0.049 (0.026–0.091), and dCA1, 0.063 (0.038–0.101); Population responses inside and outside ROI were significantly different: two-way ANOVA: band: F (2, 796) = 146.927, P < 0.001, η2 = 0.270; ROI: F (1, 398) = 422.712, P < 0.001, η2 = 0.515; band × ROI: F (2, 796) = 99.646, P < 0.001, η2 = 0.200. Holm–Bonferroni post hoc tests across subregions, *P < 0.05; ***P ≤ 0.001.

