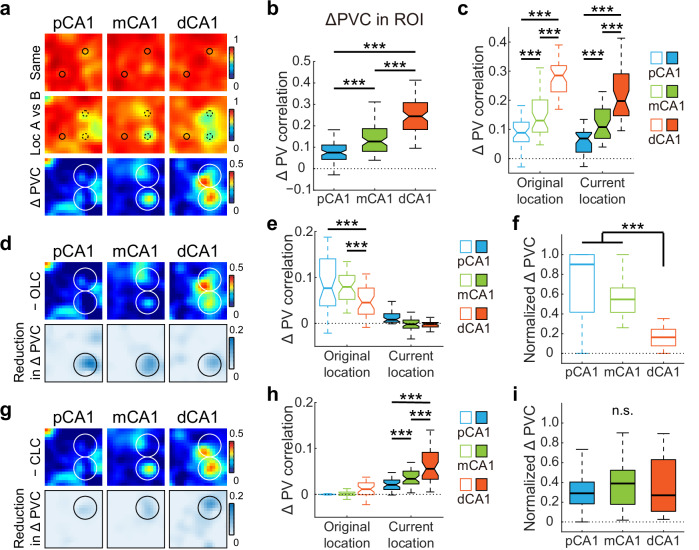
Fig. 6. Distinct contributions of neuron subpopulations during event coding.
a Heatmaps showing PVCs of place cells excluding OVC-like neurons recorded from each subregion between trials (top two rows), as well as changes in PVC between trial pairs (bottom row) in object-relocation task. Small circles represent objects, large circles indicate the target region. b Degree of changes in PVC within ROI between trial pairs across CA1 bands, with outliers omitted. pCA1, 0.075 (0.043–0.110), mCA1, 0.127 (0.081–0.187), dCA1, 0.244 (0.183–0.308); Kruskal–Wallis test, H = 128.394, P < 0.001, η2 = 0.533, n = 240 bins; Holm–Bonferroni post hoc tests, ***P < 0.001. c Degree of changes in PVC at original and current locations between trial pairs across CA1 bands, with outliers omitted. Original location: pCA1, 0.089 (0.058–0.125), mCA1, 0.130 (0.091–0.201), and dCA1, 0.285 (0.229–0.319). Current location: pCA1, 0.069 (0.022–0.090), mCA1, 0.108 (0.069–0.170), and dCA1, 0.198 (0.147–0.291); Population responses at the original and current locations were significantly different: two-way ANOVA: band: F (2, 156) = 182.131, P < 0.001, η2 = 0.700; location: F (1, 78) = 17.137, P < 0.001, η2 = 0.180; band × location: F (2, 156) = 1.187, P = 0.308. Holm–Bonferroni post hoc tests across subregions, ***P < 0.001. d Heatmaps showing changes in PVC for population of place cells without OLC neurons between trial pairs, as well as reductions in PVC change (compared to the bottom panel in (a) after exclusion for CA1 subregions. Circles indicate ROI. e Reductions in PVC at original and current locations after exclusion of OLC neurons across CA1 bands, with outliers omitted. Original location: pCA1, 0.077 (0.038–0.141), mCA1, 0.080 (0.052–0.105), and dCA1, 0.045 (0.020–0.077). Current location: pCA1, 0.008 (0.003–0.021), mCA1, −0.002 ( − 0.010–0.008), and dCA1, −0.001 (−0.008 to 0.002). Two-way ANOVA: band: F (2, 156) = 47.814, P < 0.001, η2 = 0.380; location: F (1, 78) = 121.416, P < 0.001, η2 = 0.609; band × location: F (2, 156) = 16.810, P < 0.001, η2 = 0.177. Holm–Bonferroni post hoc tests at original location, ***P < 0.001. f Normalized PVC change after OLC neuron exclusion at original location across CA1 bands, with outliers omitted. pCA1, 0.901 (0.417–1.000), mCA1, 0.547 (0.416–0.622), and dCA1, 0.163 (0.077–0.245); Kruskal–Wallis test, H = 71.904, P < 0.001, η2 = 0.597, n = 120 bins. Holm–Bonferroni post hoc tests, ***P < 0.001. g–i Similar to (d–f), but shows changes in PVC for population of place cells without CLC neurons (g), reductions in PVC (h). OL: pCA1, −0.0003 (−0.0007 to 0.0002), mCA1, 0.001 (−0.003 to 0.005), and dCA1, 0.011 (−0.001 to 0.025). CL: pCA1, 0.021 (0.010–0.031), mCA1, 0.034 (0.023–0.050), and dCA1, 0.056 (0.033–0.092); Two-way ANOVA: band: F (2, 156) = 44.460, P < 0.001, η² = 0.363; location: F (1, 78) = 150.555, P < 0.001, η² = 0.659; band × location: F (2, 156) = 15.285, P < 0.001, η² = 0.164. Holm–Bonferroni post hoc tests at CL, all P < 0.001, and normalized PVC change at current location (i). pCA1, 0.290 (0.183–0.404), mCA1, 0.389 (0.178–0.523), and dCA1, 0.270 (0.107–0.630); Kruskal–Wallis test, H = 0.658, P = 0.720, n = 120 bins. Holm–Bonferroni post hoc tests, n.s. not significant; *P < 0.05; **P < 0.01, ***P < 0.001.

