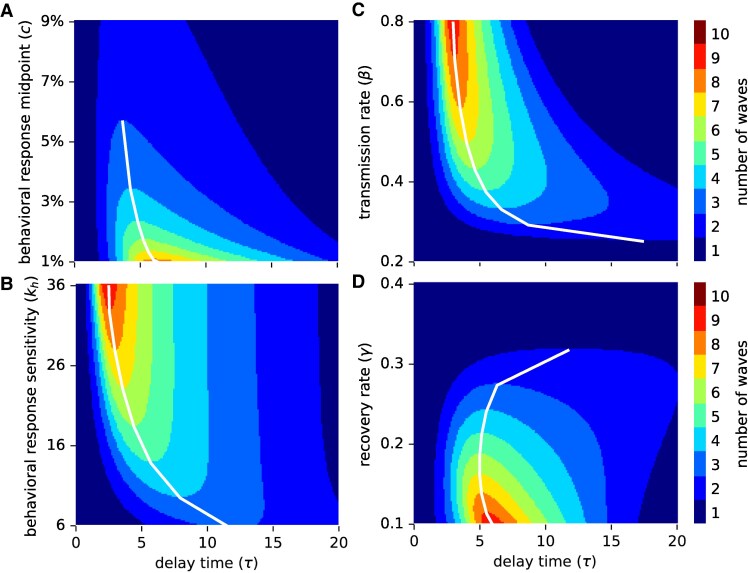
Fig. 3.
2D sensitivity analysis. The number of epidemic waves is shown for a range of values for the delay parameter (τ, x-axis) and another model parameter (y-axis): A) behavioral response midpoint c, B) behavioral response sensitivity , C) transmission rate β, D) recovery rate γ. White lines connect the highest (in A, D) or lowest (in B, C) model parameter value and associated delay value that yields a specific number of multiple waves. All nonspecified parameters are at their default values listed in Table 1.

